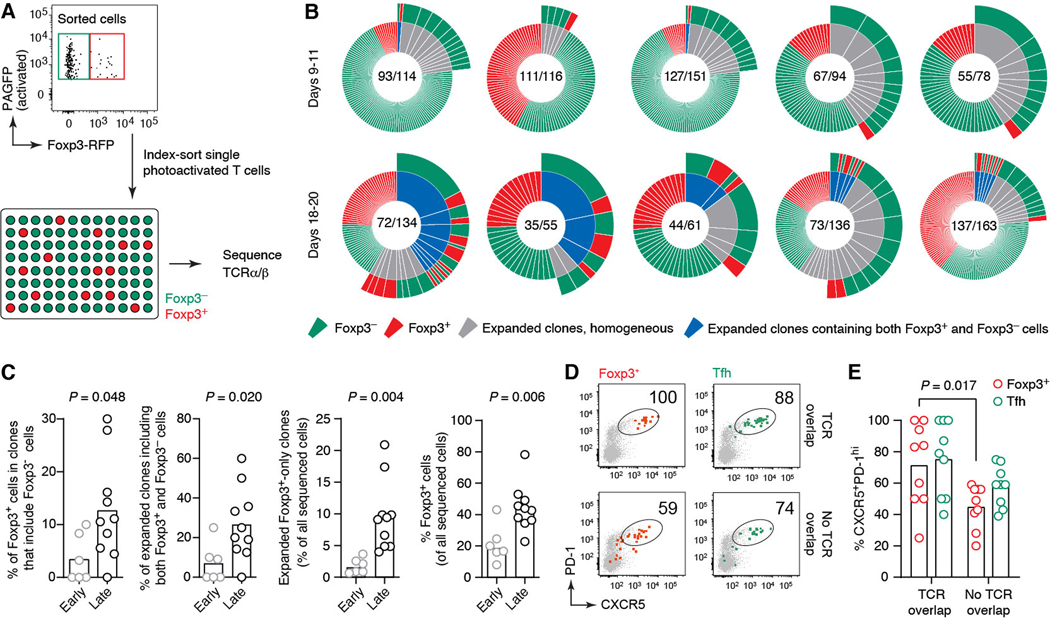
Fig. 4: A subset of late-GC Foxp3+ T cells arises via upregulation of Foxp3 by Tfh cells.
(A) Experimental setup. RFP+ and RFP– T cells from single photoactivated GCs obtained from Foxp3RFP+ PAGFP-tg mice at days 9–11 (early) or 18–20 (late) after primary immunization with NP-OVA were index-sorted for TCRα and β sequencing. (B) Clonal distribution of T cells within single GCs. Each pie chart represents one GC. Numbers are (number of clones/number of cells sequenced). Expanded clones (defined as those found more than once within the same GC) are colored in gray when including only one cell type or blue when including both cell types, with the cell type composition of the clone indicated in the outer circle. Additional pie charts can be found in fig. S3; full TCR sequences are available as Supplementary Data S1. (C) Quantification of data in (B), comparing early and late time points. Each symbol represents one GC. Includes additional late GCs not shown in (A). (D) Expression of Tfh markers among RFP+ and RFP– cells stratified by TCR overlap, obtained from index-sorting data. “Overlapping” cells are defined as those belonging to clones that contain both RFP+ and RFP– cells. (E) Quantification of data in (D). Each symbol represents one GC. Data are for 6 GCs from 5 independent experiments (days 9–11) and 10 GCs from 9 independent experiments (days 18–20). Bar indicates the median. P-values are for Student’s t test.

