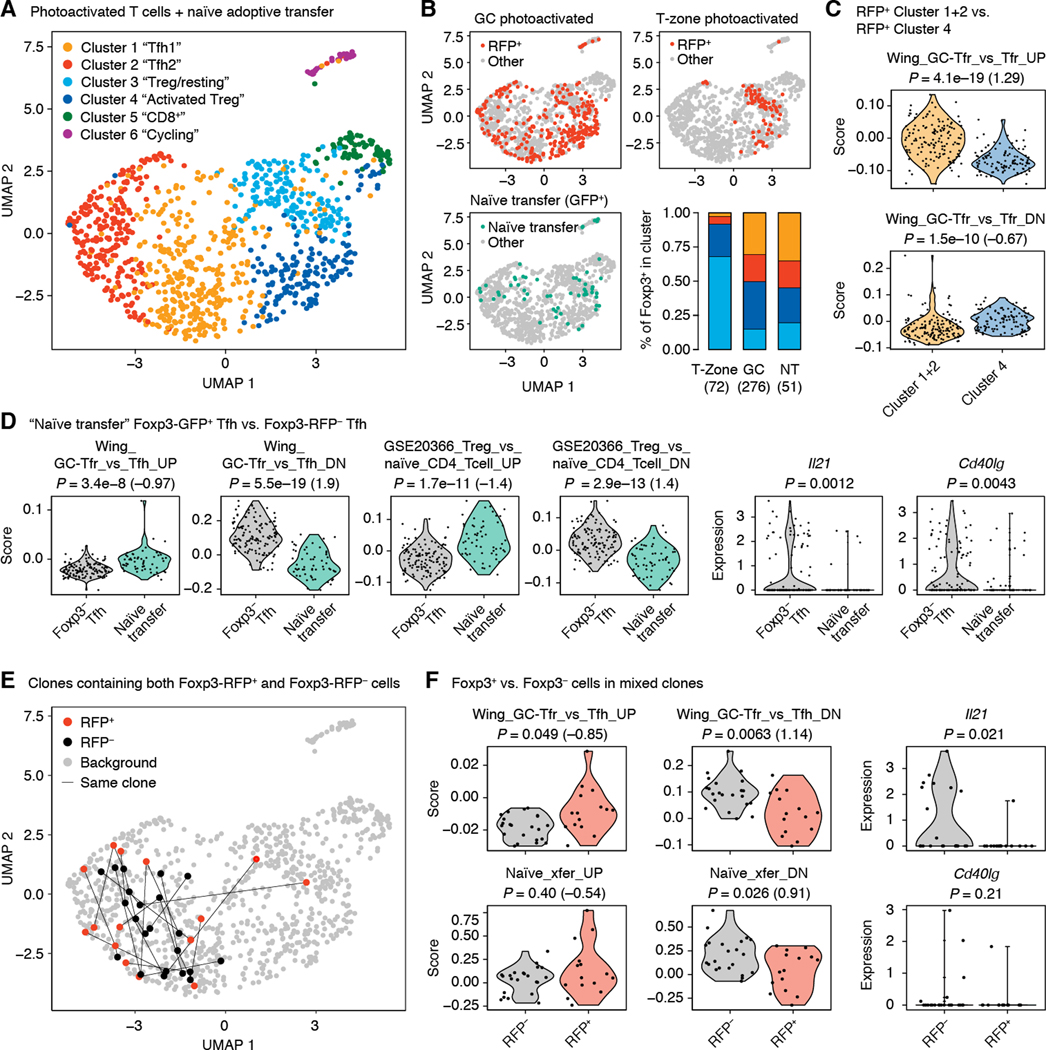
Fig. 6. scRNA-seq of GC-resident T cells.
Total T cells (Foxp3RFP+ and Foxp3RFP– combined) from single photoactivated GCs were sorted either as B220–/CD4+/PA+ or as B220–/TCRβ+/PA+ (which also includes CD8+ T cells) in different samples at days 10 or 20 after primary immunization with NP-OVA. For comparison, we also sorted Treg cells photoactivated in the T-zone of an unimmunized mouse, sorted as B220–CD4+GFP+RFP+ and Foxp3+CXCR5+PD-1hi Tfh cells derived from transferred naïve precursors as in Fig. 5. (A) UMAP plot showing clustering of T cells according to whole transcriptome analysis. (B) Distribution of different subsets of Foxp3-reporter+ cells in UMAP space. Cells in color are those that are Foxp3-reporter+ in the sample indicated in the graph title. All other analyzed cells are shown in gray. Bar graph shows distribution of T-zone and GC RFP+ cells among clusters 1–3. (C) Expression of selected gene signatures by Foxp3RFP+ and Foxp3RFP– cells within Tfh Clusters 1 and 2. (D) Expression of selected genes or gene signatures by Foxp3+ Tfh cells derived from transferred naïve precursors compared to photoactivated Foxp3– Tfh cells. Only cells from day 20 post-immunization are included in the Foxp3– Tfh group. “GSE20366” signatures are from the Broad Institute’s MSigDB database. (E) Distribution of clonal expansions (defined as TCRs detected more than once in the same GC) containing both RFP+ and RFP– cells (“mixed clones”). Cells carrying identical TCRs are linked by lines. (F) Expression of selected genes or gene signatures by Foxp3-RFP+ and Foxp3-RFP – cells within mixed clones. (A-F) Each symbol represents one cell. P-values are for the Wilcoxon signed-rank test. Numbers in parentheses are Cohen’s d for effect size. The number of GCs included and number of independent experiments are indicated in Table S1.

