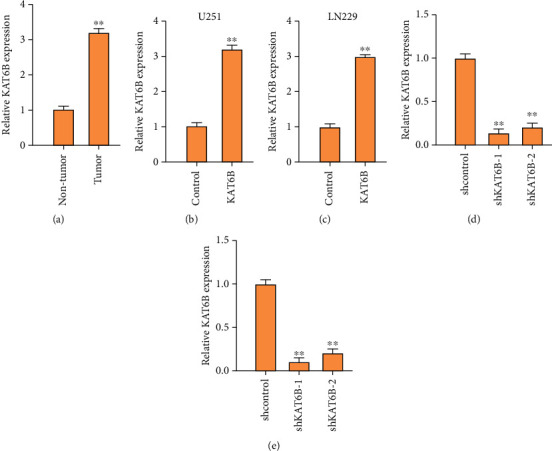
Figure 1.

KAT2B is elevated in the clinical glioma samples. (a) The expression of KAT2B was measured by qPCR in clinical glioma tissues (n = 35). (b, c) The U251 and LN229 cells were treated with KAT2B overexpressing plasmids, and the expression of KAT2B was detected by qPCR in the cells. Empty plasmid was served as the control. (d, e) The U251 and LN229 cells were treated with shRNAs, and the expression of KAT2B was analyzed by qPCR in the cells. Lentivirus vector containing negative control RNAi sequence was served as shcontrol. ∗∗p < 0.01.
