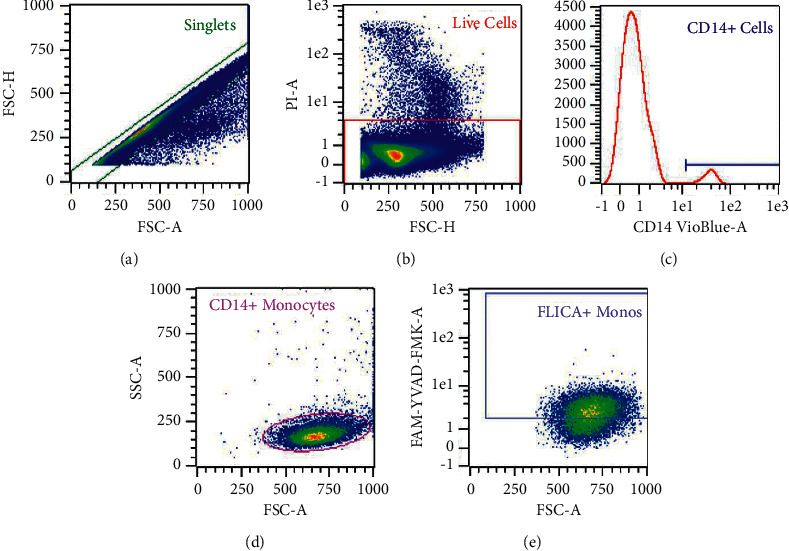
Figure 2.

Hierarchical gating strategy for quantification of activated caspase-1 by flow cytometry on a representative sample. (a) Singlets were selected. (b) Live cells were selected for negative staining for propidium iodide (PI). (c, d) Monocytes were selected by positive staining for CD14 and scatter characteristics. (e) Monocytes displaying positive staining for FAM-FLICA (representative of expression of activated caspase-1) were quantified by median fluorescence intensity and percent positive.
