
Figure 3.
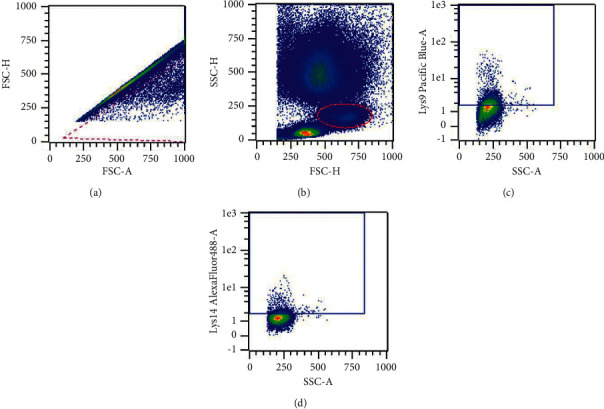
Hierarchical gating strategy for quantification of acetylated histone H3 on lysine residues 9 and 14 on a representative sample. (a) Singlets were included by negative selection. (b) Monocytes were selected by characteristics scatter profile. (c, d) Staining for acetylation of lysine residues 9 and 14 was quantified by the median fluorescence intensity and percent staining positive on monocytes.