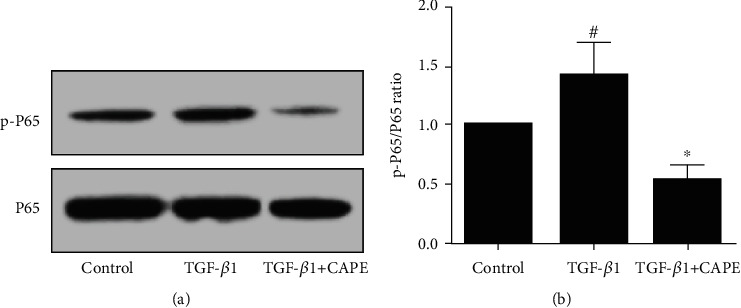
Figure 8.

P65 phosphorylation level in the TGF-β1-induced smooth muscle cells. (a) The protein expressions of phospho-P65 and P65 were detected by Western blot. (b) The ratio of p-P65/P65 was quantified. TGF-β1 group: the smooth muscle cells were treated with 10 ng/ml TGF-β1 for 30 minutes; TGF-β1+CAPE group: before stimulation with TGF-β1, the cell was pretreated with CAPE (100 nM) for 30 minutes. #P < 0.05 vs. the control group. ∗P < 0.05 vs. the TGF-β1 group.
