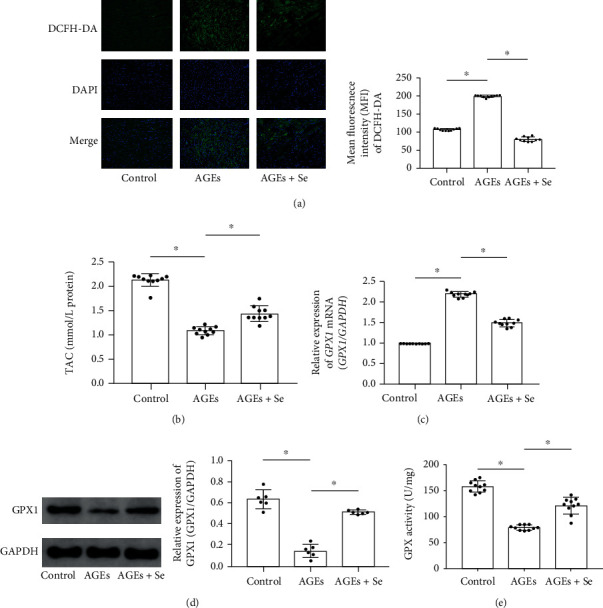
Figure 2.

(a) Images of ROS indicator DCFH-DA stains of cardiac tissue sections were demonstrated. Columns indicated mean fluorescent intensities of DCFH-DA in control, AGE, AGE + Se groups, respectively. (b) Columns indicated the detected total antioxidant capacity (TAC) of cardiac tissue homogenates from rats in control, AGE, and AGE + Se groups. (c) Columns indicated relative expression levels of GPX1 mRNA in cardiac tissue of rats from control, AGE, and AGE + Se groups. (d) Immunoblots of GPX1 and GAPDH were demonstrated. Columns indicated relative expression of GPX1. (e) Columns indicated measured GPX activity cardiac tissue homogenates from rats in control, AGE, and AGE + Se groups. Magnification of images in Figure 2(a) was 200 (control: rats treated with control BSA; AGEs: rats treated with AGE-BSA; AGEs + Se: rats treated with AGE-BSA then supplemented with sodium selenite (n = 10, ∗P < 0.05)).
