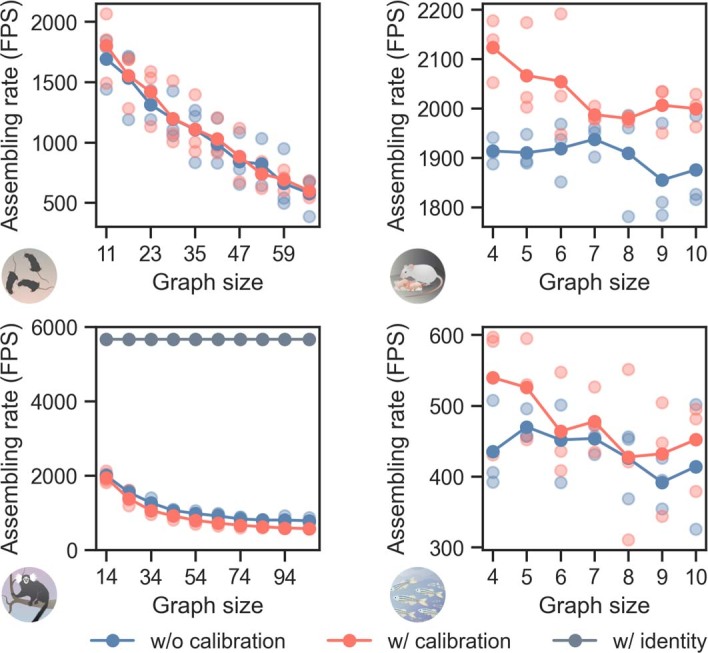
Extended Data Fig. 5. Average animal assembly speed in frames per second as a function of graph size.

Assembly rates vs. graphs size for the four datasets. Improving the assembly robustness via calibration with labeled data in large graphs incurs no extra computational cost at best, and a slowdown by 25% at worst; remarkably, it is found to accelerate assembly speed in small graphs. Relying exclusively on keypoint identity prediction results in average speeds of around 5600 frames per second, independent of graph size. Three timing experiments were run per graph size (lighter colored dots) and averages are shown. Note that assembling rates exclude CNN processing times. Speed benchmark was run on a workstation with an Intel(R) Core(TM) i9-10900X CPU 3.70GHz.
