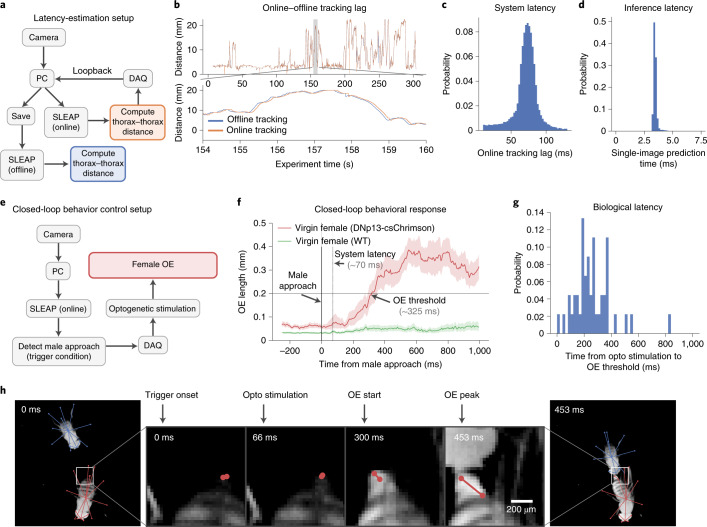
Fig. 6. SLEAP can detect social behavior for real-time control.
a, Schematic of hardware setup for detecting poses, calculating thorax–thorax distance and estimating round-trip latency through a DAQ loopback. PC, personal computer. b, Lag between online and offline distance traces estimates round-trip system latency. c, Distribution of round-trip system latency estimated by aligning 1-s segments between offline and online traces (mean = 71.0 ms, s.d. = 17.0 ms, n = 50,000 1-s segments). d, Distribution of end-to-end top–down ID model inference latency for single images (mean = 3.45 ms, s.d. = 0.16 ms, n = 1,280 images over five replicates). e, Hardware setup for detecting poses, trigger condition (male approach), optogenetic stimulation (of DNp13) and control of virgin female behavior (OE). f, Female behavioral response (change in OE length) to male approach-triggered optogenetic activation of DNp13 neurons expressing csChrimson (red) or in virgin WT females (green). The line and shaded regions denote mean and 95% confidence intervals (n = 48 bouts, DNp13; n = 282 bouts, WT). g, Distribution of latency from optogenetic (opto) stimulation onset to OE threshold, indicating the biological latency of the system (mean = 249.0 ms, s.d. = 148.1 ms, n = 48 bouts). h, Example closed-loop behavioral control event. From left to right: male in approach pose at condition trigger onset; optogenetic stimulation onset; start of female OE response to optogenetic stimulation; peak of female OE response with male still in close proximity.

