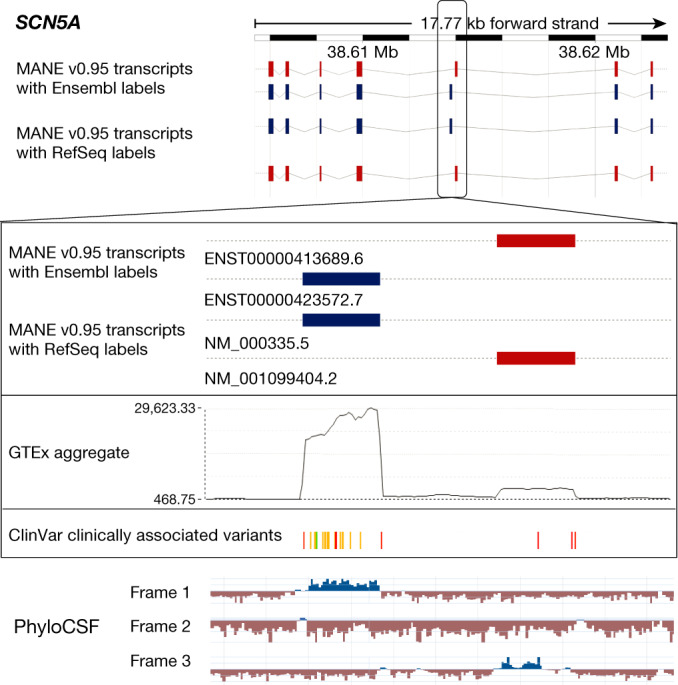
Fig. 2. The need for a MANE Plus Clinical transcript for the SCN5A (HGNC:10593) gene.

Top, Ensembl browser display of the SCN5A gene showing MANE Select (blue) and MANE Plus Clinical (red) transcripts (Ensembl/GENCODE on top and RefSeq below) from MANE release v0.95. Bottom, magnified view of the portion of the gene that includes two mutually exclusive exons. The tracks are as described below, from top to bottom. Track 1, MANE v0.95 track showing the upstream MANE Select exon and downstream MANE Plus Clinical exon, shown in blue and red, respectively. Track 2, GTEx aggregate exon coverage (black wiggle plot). Track 3, ClinVar variants described as P or LP, coloured to indicate the type of variant (green, synonymous; yellow, missense; red, stop gained). Track 4, PhyloCSF tracks (one row for each frame) from NCBI GDV, with positive signal shown in blue.
