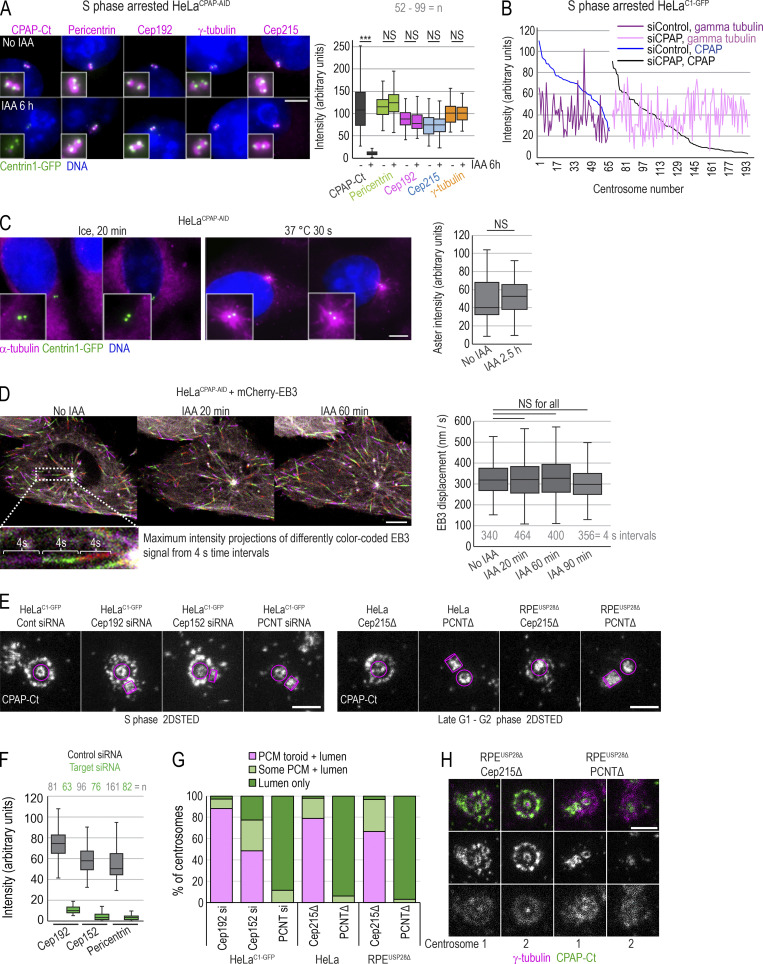
Figure 4.
Acute removal of CPAP does not perturb centrosome PCM recruitment or MT nucleation in interphase. (A) S phase–arrested cells were treated or not with IAA for 6 h, immunolabeled for indicated PCM proteins, and imaged. Plot: Quantification of PCM proteins is shown in box-and-whiskers plot. n = cell number. (B) Cells were treated with CPAP siRNA, arrested in S phase for 26 h, immunolabeled for γ-tubulin and CPAP, and imaged. The levels of CPAP and γ-tubulin were determined and plotted for each centrosome. No correlation between centrosome-associated CPAP and γ-tubulin was observed after plotting. (C) MT nucleation recovery after cold treatment. IAA treatment for 2.5 h does not change the intensity of MT asters, labeled by α-tubulin, after recovery. n = number of asters. (D) Cells expressing mCherry-EB3 were imaged every second over 1 min to record the position of growing MT tips. Maximum-intensity projections of four 1-s frames were generated and color coded (as shown in inset). Displacement of mCherry-EB3 in 4-s intervals was measured for MTs showing linear growth. Box-and-whiskers plot represents displacement of mCherry-EB3 signals within the same cell before and after 20, 60, or 90 min of IAA treatment. n = number of measured 4-s intervals. (E) CPAP was detected by immunofluorescence in HeLaC1-GFP cells depleted for Cep192, Cep152, or pericentrin (PCNT) and in RPE1-USP28Δ cells knocked out for pericentrin or Cep215. CPAP signal was imaged by 2DSTED. Removal of pericentrin results in the loss of the PCM CPAP population. Magenta lines delineate centriole’s position and orientation. (F) Levels of indicated protein on centrosomes of cells transfected with control and targeting siRNA. (G) Plot: Characterization of CPAP phenotypes observed from 2DSTED recordings. (H) Interphase centrosomes in Cep215 and pericentrin knockouts associate with γ-tubulin. n = centrosome number. Scale bars: 5 µm (A, C, and D); 0.5 µm (E and H). ***, P ≤ 0.001.

