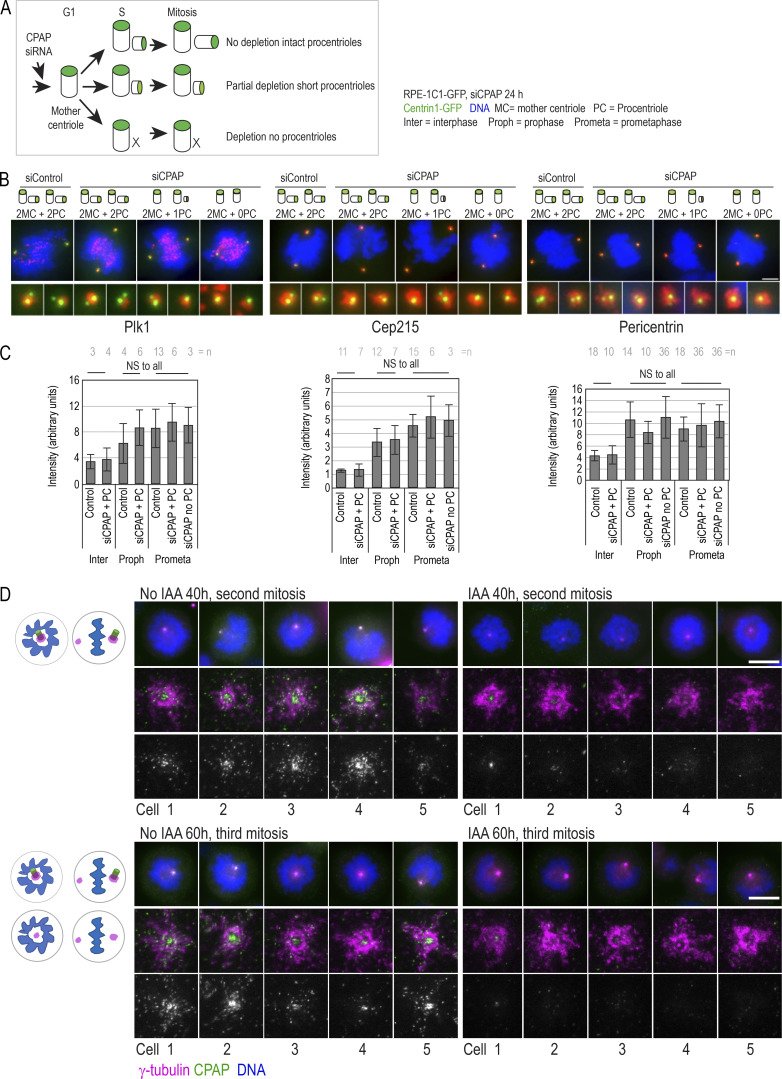
Figure S4.
The effect of CPAP removal on recruitment of PCM in mitosis by structurally intact mother centrioles. (A–C) Characterization of PCM recruitment by intact mother centrioles in RPE-1 cells after CPAP depletion. RPE-1 cells were collected by shake-off, replated, and transfected with CPAP siRNA or control non-targeting siRNA ∼2 h later. Cells were fixed 24 h after shake-off, when they were undergoing mitosis. Cells were immunolabeled for PLK1, Cep215, and pericentrin, and analyzed by microscopy. Please note that all cells at the time of fixation harbor structurally intact mother centrioles formed before CPAP depletion. (A) Cartoon depicting the effect of various levels of CPAP depletion by siRNA on centriole duplication. (B) Examples of mitotic cells immunolabeled for indicated PCM proteins after CPAP depletion. Mother centriole duplication status is indicated above the image. Cells with unduplicated mother centrioles were considered depleted for CPAP. The images show that both control and CPAP-depleted mother centrioles contain similar levels of PCM components. (C) Quantification of PCM signals on centrosomes formed by control or CPAP-depleted mother centrioles. (D) Characterization of γ-tubulin recruitment by intact mother centrioles in HeLaCPAP-AID cells after CPAP degradation. HeLaCPAP-AID were shaken off and 2 h later treated with IAA to degrade CPAP and with centrinone to prevent duplication of mother centrioles (see Fig. 3 G). Cells were fixed 40 or 60 h after shake-off, when they were undergoing their second and third mitosis, respectively. Cells were immunolabeled for γ-tubulin and CPAP and imaged by wide-field. Corresponding centriole-containing spindle poles were additionally imaged using 2DSTED. Images show examples of mother centriole-containing spindle poles. In IAA-treated cells, mother centriole-associated CPAP is reduced or undetectable. However, γ-tubulin is accumulated to mitotic spindle poles at levels comparable to the controls. Cartoons depict mitotic figures present in the population at indicated times. n = centrosome number. Scale bars: 5 µm (B); 10 µm (D); 1 µm (enlarged centrioles in D).

