Figure 9.
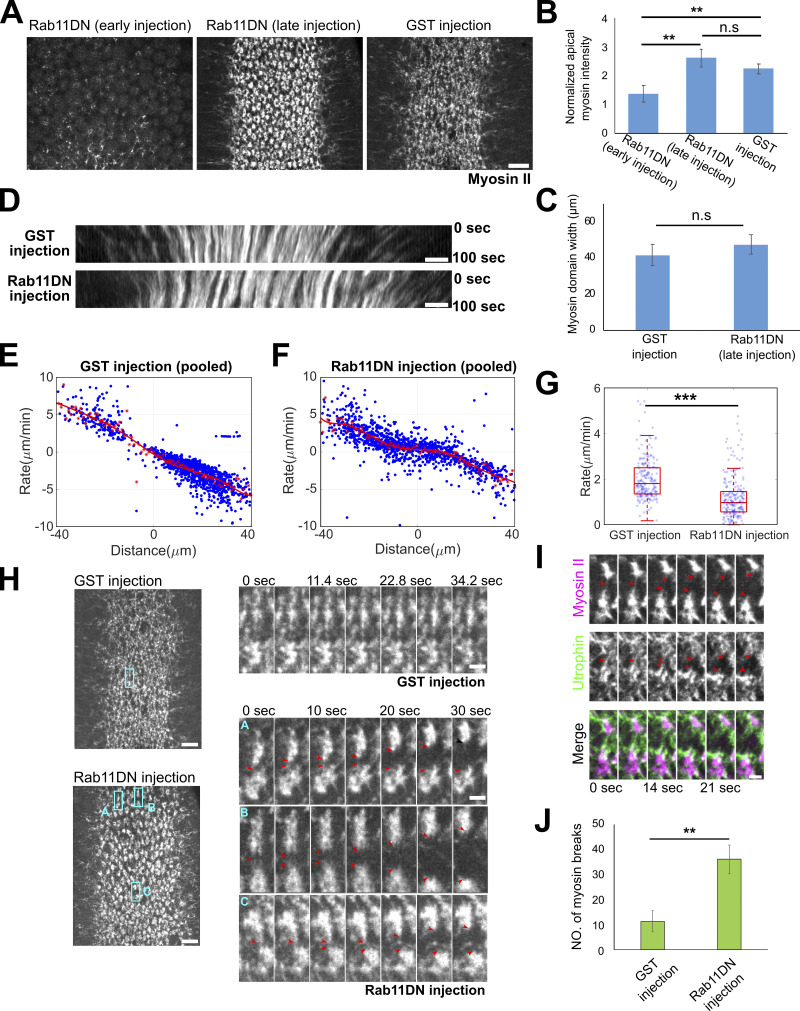
Acute inhibition of Rab11 results in defects in Myosin II organization and apical constriction. (A–C) Stage-dependent effect of Rab11DN injection on apical myosin network. (A) Injection of Rab11DN at early cellularization (>30 min before the onset of gastrulation) impairs apical myosin II activation (N = 3 embryos), whereas injection around the onset of gastrulation does not affect myosin II activation but causes defects in apical myosin organization (N = 4 embryos). GST injection: N = 3 embryos. Scale bar, 10 μm. (B and C) Quantification of apical myosin II intensity (B) and the width of myosin domain (C) at ∼6–7 min after the onset of gastrulation. Error bars stand for SD. Two-sample, two-tailed unpaired t test was used for statistical comparison. **, P < 0.01; n.s., P > 0.05. (D) Example kymograph showing the movement of apical myosin II toward ventral midline at ∼6–7 min into gastrulation. Only the late Rab11DN injected embryos were analyzed in D–K. Scale bars, 5 μm. (E–G) Quantification of apical constriction rate in embryos injected with GST and Rab11DN. (E and F) Rate of ventral movement of myosin structures as a function of their initial position relative to the ventral midline. Red asterisks: average velocity. Red curve: polynomial fit. (G) Rate for myosin structures located 10–15 μm away from the ventral midline. The central mark indicates the median, and the bottom and top edges of the box indicate the 25th and 75th percentiles, respectively. The whiskers extend to the most extreme data points not considered outliers. Two-sample, Two-tailed unpaired t test was used for statistical comparison. ***, P < 0.001. (H–J) Rab11DN injection increases the frequency of myosin breaks during apical constriction. (H) Left, representative surface views of the supracellular myosin network. Scale bars, 10 μm. Right, zoom-in view showing myosin dynamics over time. Red arrowheads: myosin breaks. Scale bars, 2 μm. (I) Myosin breaks are associated with breaks in the underlying F-actin network (UtrophinABD-Venus). Scale bar, 2 μm. N = 3 embryos for each condition. (J) Quantification of the number of myosin breaks over a ∼100-s time window at ∼6–7 min after apical constriction starts. Error bars stand for SD. Two-sample, two-tailed unpaired t test was used for statistical comparison. **, P < 0.01.

