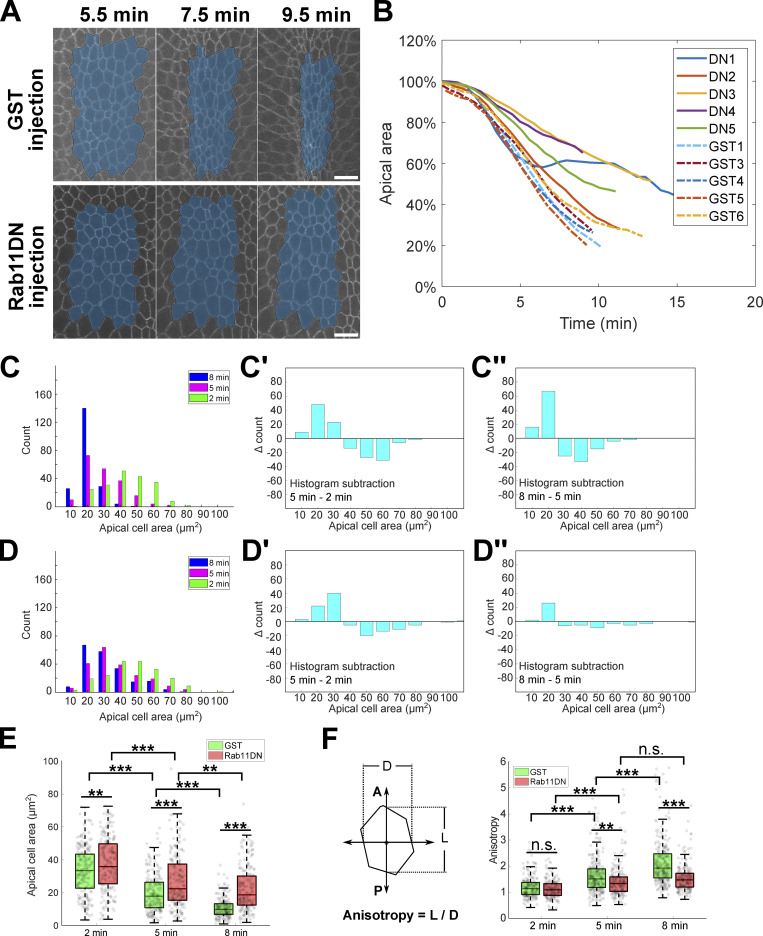
Figure S5.
Acute inhibition of Rab11 results in a reduced rate of apical constriction. (A) Representative images showing apical cell area change in GST injected embryo and Rab11DN injected embryo during apical constriction. A single z plane at 3–4 μm depth from the apical surface is shown. The total area of a cell group (masked in blue) located in the middle of the constriction domain was tracked over time and quantified in B. Scale bars, 10 μm. (B) Apical area change over time. Five embryos were injected with Rab11DN (DN1-DN5) and six embryos were injected with GST (GST1-GST6). The GST2 embryo was not used for quantification because it exhibited abnormal cell shape even before gastrulation. (C and D) Histograms of individual cell area distribution at 2, 5, and 8 min after the onset of gastrulation for GST (C, N = 4 embryos, GST1 embryo was not included due to lack of data at 2 min) and Rab11DN (D, N = 5 embryos) injected embryos. The change in area distribution is reflected by histogram subtraction between neighboring time points in the corresponding background (C’, C’’, D’, and D’’). In the 2–5 min period, apical area reduction in GST (C’) and Rab11DN (D’) injected embryos is in general comparable. However, in the 5–8 min period, while cells in GST (C’’) injected embryos continue to reduce their apical area, cells in Rab11DN (D’’) injected embryos only show a very mild area reduction. (E) Box plot showing the average cell area at indicated time point for GST and Rab11DN injected embryos. The central mark indicates the median, and the bottom and top edges of the box indicate the 25th and 75th percentiles, respectively. The whiskers extend to the most extreme data points not considered outliers. Two-sample, two-tailed unpaired t test was used for statistical comparison. ***, P < 0.001; **, P < 0.01. (F) Quantification of anisotropy for individual constricting cells at 2, 5, and 8 min after the onset of gastrulation. Same embryos from C–E were analyzed. Compared to GST injected control embryos, Rab11DN injected embryos show a substantially attenuated increase in anisotropy in the 5–8 min period. The central mark indicates the median, and the bottom and top edges of the box indicate the 25th and 75th percentiles, respectively. The whiskers extend to the most extreme data points not considered outliers. Two-sample, two-tailed unpaired t test was used for statistical comparison.

