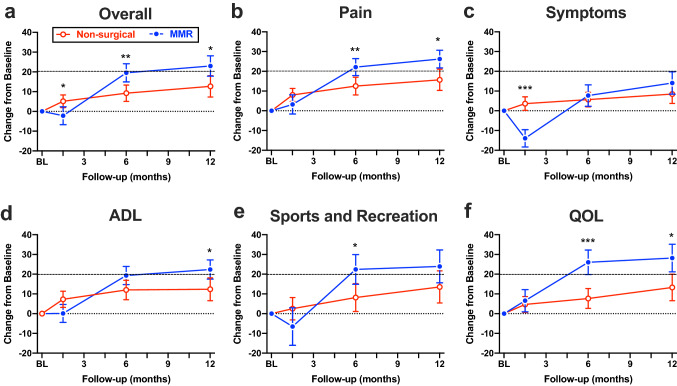
Fig. 3.
Change in KOOS subscales. Magnitude of change from baseline (BL) to 1 year of follow-up in KOOS Overall (a), pain (b), symptoms (c), activities of daily living (ADL; d), sports and recreation (e), and quality of life (QOL; f). Symbols indicate the mean and error bars are 95% confidence intervals. Open red symbols represent the non-surgical care group and closed blue symbols represent the medial meniscus replacement (MMR) implant group. Higher values indicate better improvement in pain, symptoms, function, or quality of life. *Indicates P < 0.05, ** indicates P < 0.01, and *** indicates P < 0.001 for MMR group vs non-surgical care group

