
Figure 3. Functional characterization of aspirin’s effects on platelet gene expression.
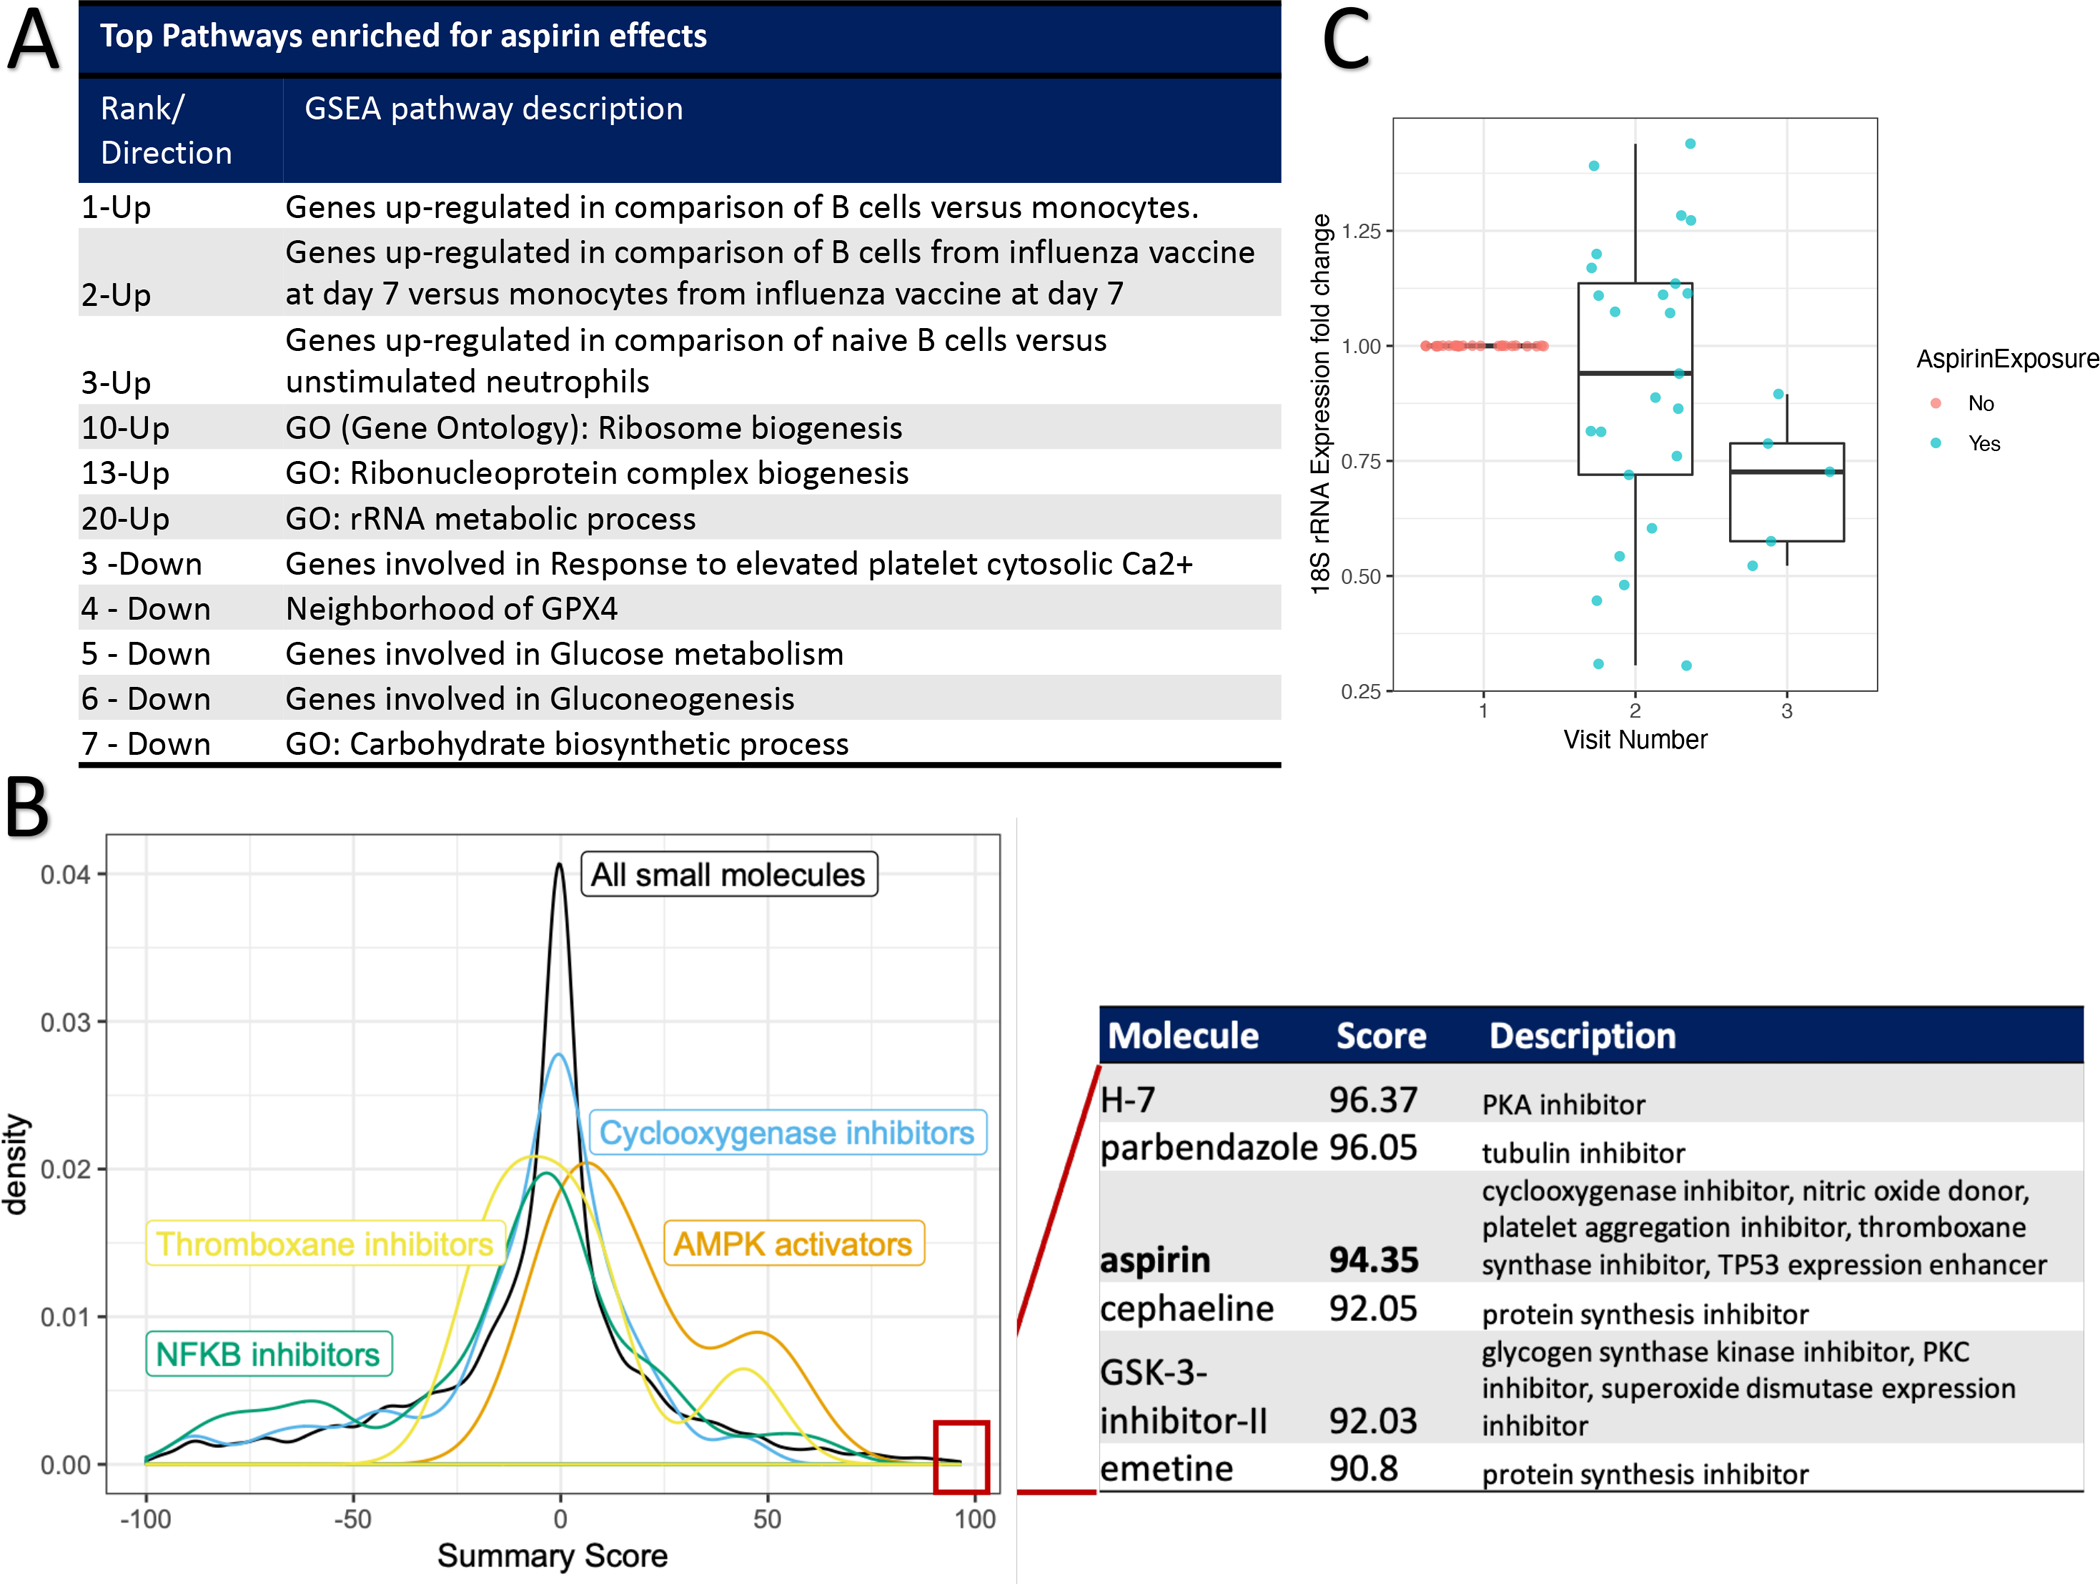
Panel A: Selected, top pathways to emerge from Gene Set Enrichment Analysis (GSEA, see Methods). For each selected pathway, its rank as well as direction of enrichment is listed. See Supplemental Figure 1 for GSEA results. Panel B: Connectivity Map analyses (see Methods). A density plot of summary scores (tau, x-axis) for different sets of small molecules in the Connectivity Map database: All small molecules (n = 2837) or subsets based on their mechanisms of action: “Cyclooxygenase inhibitors” (n = 67), “Thromboxane synthase inhibitors” (n = 13), “NFKB inhibitors” (n = 35), and “AMPK activators” (n = 4). The table lists those small molecules with the highest tau summary scores, their individual scores, and attributed mechanisms of action. Panel C: Fold change in platelet 18S ribosomal RNA (rRNA, y-axis) before (Visit 1) or after 4- or 8-weeks of 325mg/day aspirin therapy (Visits 2 and 3, respectively).