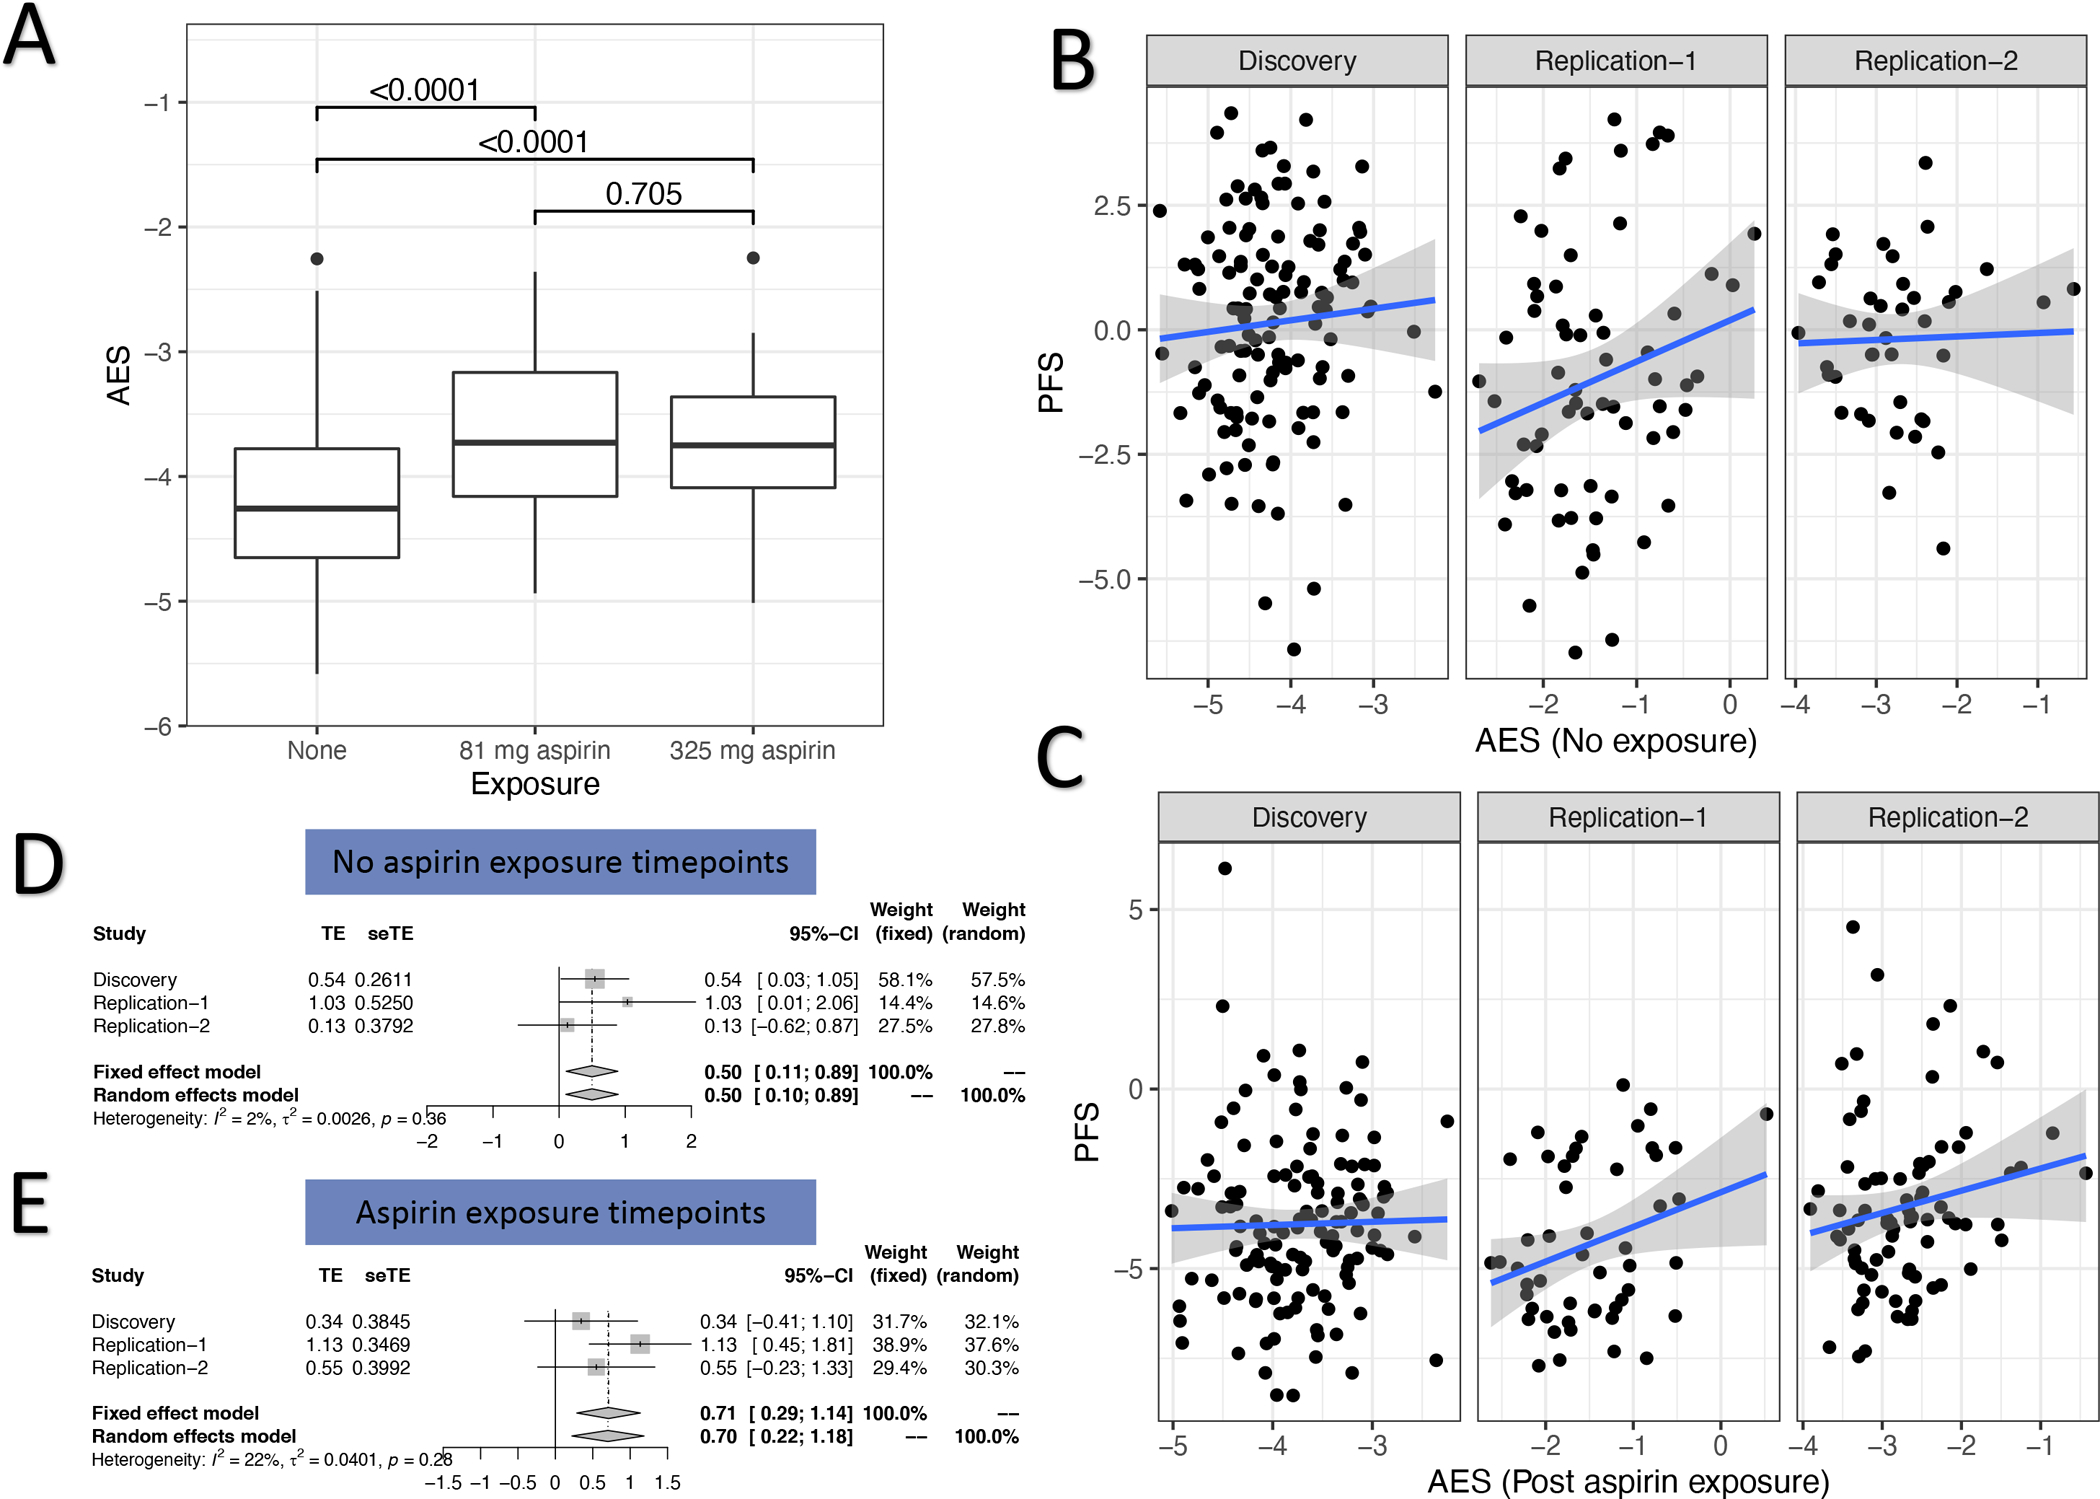
Figure 4. Aspirin’s effect on platelet gene expression and association with non-COX1 dependent platelet function measures.

Panel A: Effect of aspirin on an aggregate Aspirin Exposure Signature (AES, see Methods) that aggregates the effects of aspirin on the top aspirin-responsive genes into a single score. Values indicate p-value for comparisons between exposures. Panel B (no aspirin exposure) and C (aspirin exposure) depict correlations between AES (x-axis) in each of the cohorts (Discovery, Replication 1, and Replication 2) against a previously described platelet function scores (PFS, y-axis) which is an aggregate a panel of individual non-COX1 dependent platelet function assays. Points represent individual patients, straight line represents best fit linear regression, shaded region represents 95% confidence intervals. Panels D (no aspirin exposure) and E (post aspirin exposure) forest plots from the meta-analysis of the correlation between AES and PFS. In each plot, the correlation (treatment effect, TE) and its standard error (seTE) from a linear regression model of AES vs. PFS is plotted for each cohort (Discovery and each Replication). In addition, we plot the fixed- and random-effects correlation from a meta-analysis of TEs across cohorts.
