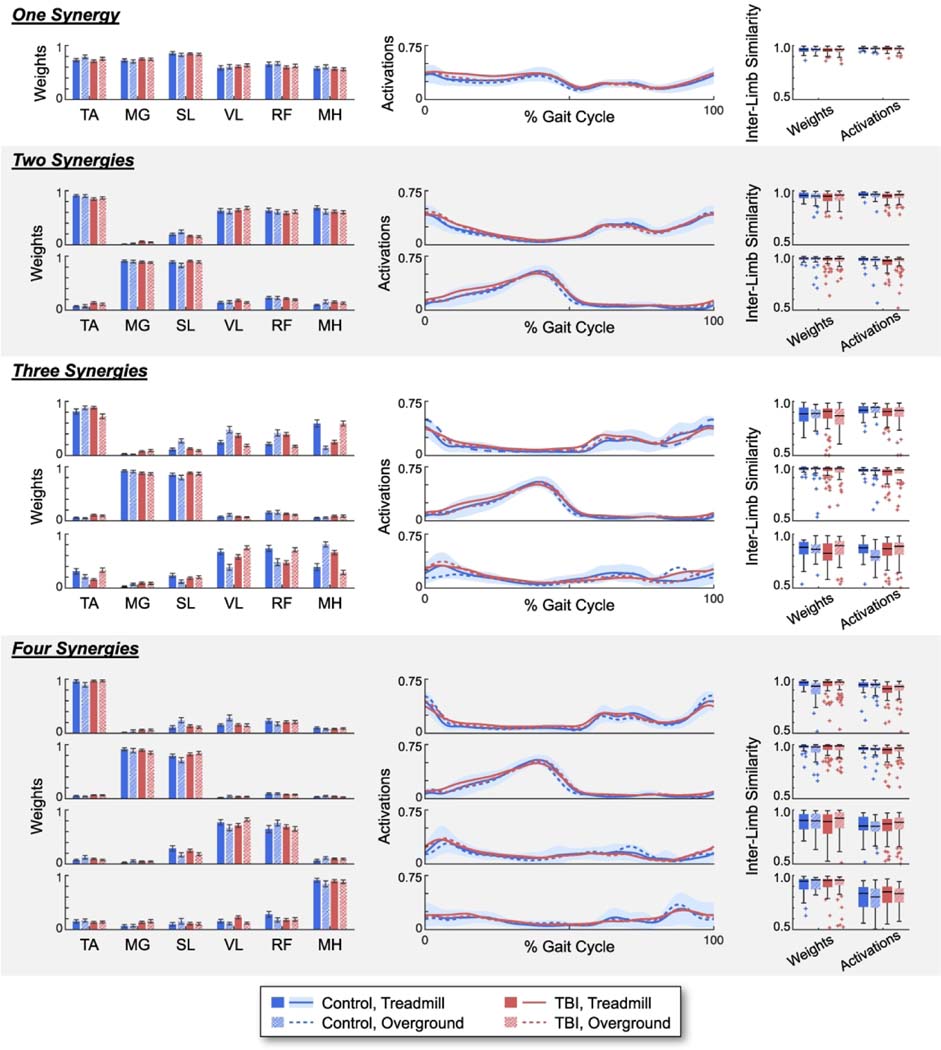
Fig. 3.
Group average muscle synergy weights and activations using one to four synergies, as well as the inter-limb similarity of the muscle synergy weights and activations within each group. Synergy weights for each muscle are plotted as mean ± standard error. Synergy activations plotted as the mean activation over the gait cycle. The shaded bar represents the standard deviation for the controls during treadmill walking. Inter-limb similarity plotted as boxplots of the cosine similarity between individual synergy weights and activations and the group average.
TA = tibialis anterior; MG = medial gastrocnemius; SL = soleus; VL = vastus lateralis; RF = rectus femoris; MH = medial hamstrings.

