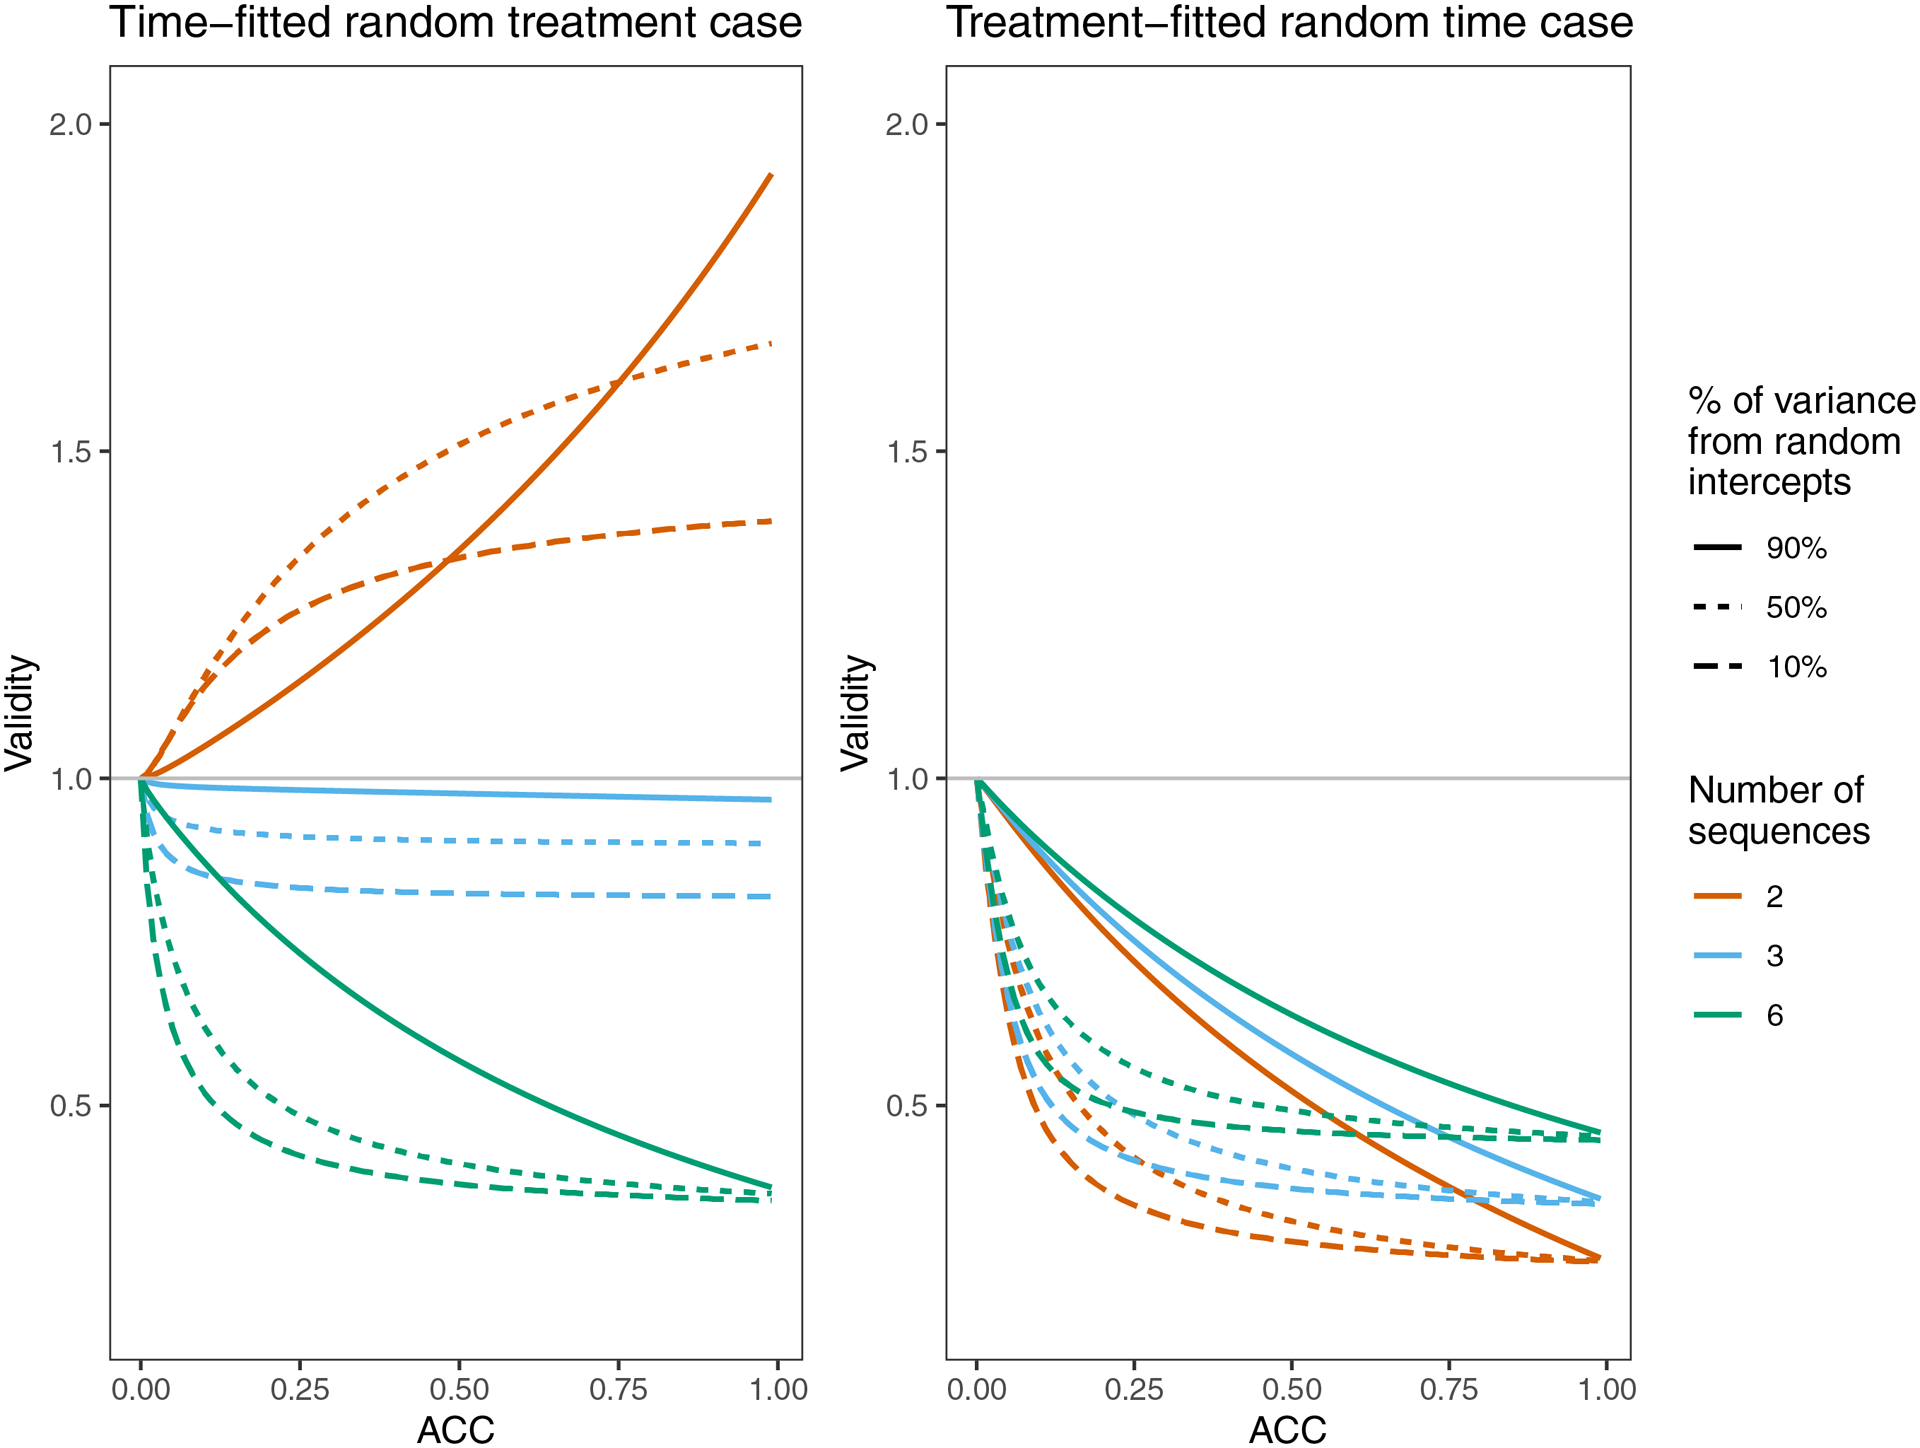
Figure 3:

Validity of Root 1 for both cases, for three designs and a variety of true ACC’s. The three classic designs (M=2, M=3, and M=6 sequences) each have K=20 observations per cluster per time period. Throughout, . Each ACC is achieved in three different ways by adjusting the balance of and or . If or , 50% of the average between-cluster variance (the numerator of the ACC) comes from random intercepts. Similarly, if or , then 90% of the variance comes from random intercepts and if or , then 10% of the variance comes from random intercepts.
