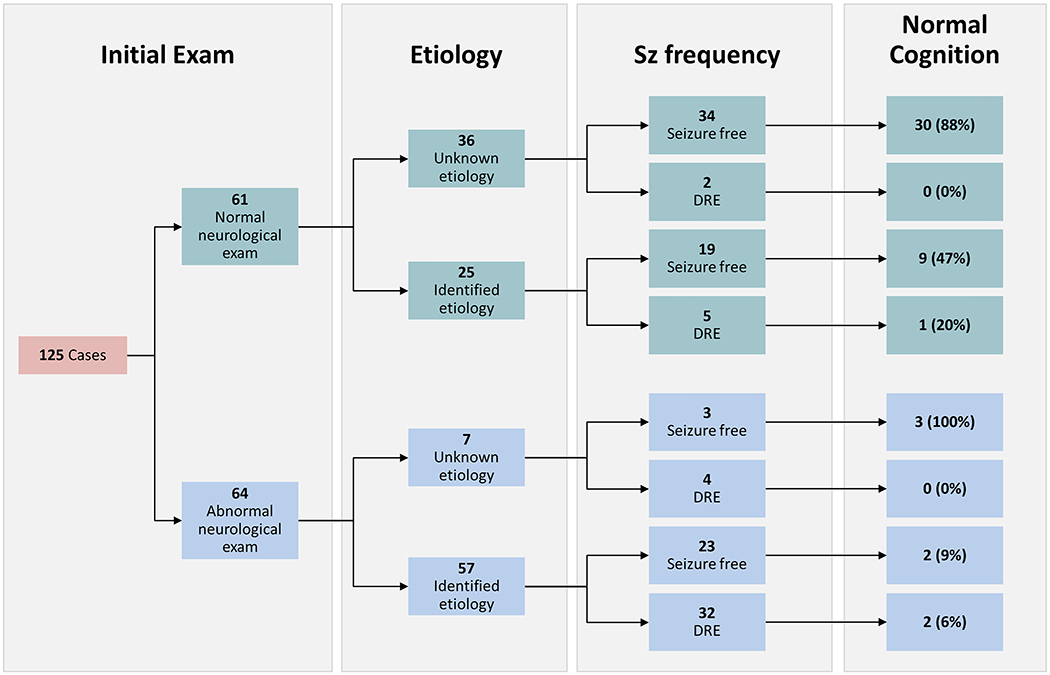
Figure 4. Outcomes of Focal Infantile-Onset Epilepsy.

Chart tracks outcomes based on initial exam and etiology. Initial exam refers to overall neurological exam; 73.8% of those with normal exam were also cognitively normal, the remainder had only mild delay. Only 13.8% of those with abnormal initial exam were classified as developmentally normal, 44.6% had severe delay. Seizure frequency shows cases which had been seizure free for >12 months at last follow-up with or without ASMs and those with DRE. Any remaining cases had ongoing seizures with ASM not yet meeting criteria for drug-resistance (not shown). The percent of each group that was developmentally normal at last follow-up is also shown, the remainder of each group had at least some degree of delay; the highest rates of moderate/severe delay were in those cases with identified etiology.
