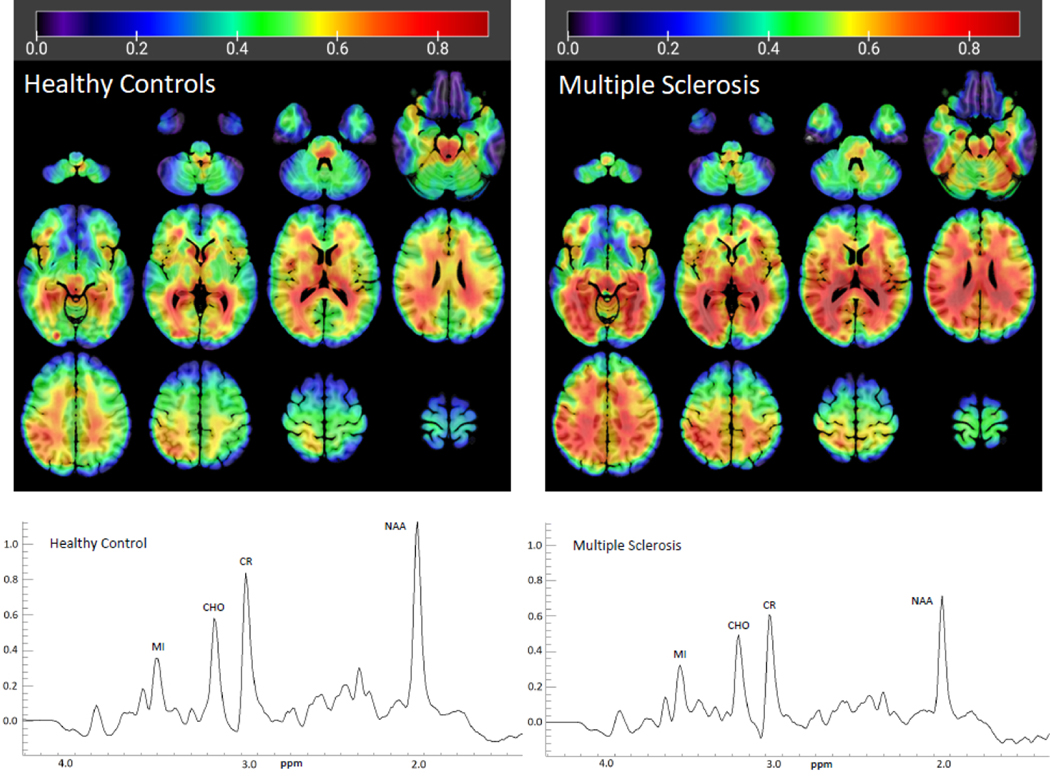
Figure 1.
Average MI/CR ratios in the groups of older healthy controls (left) and older adults with multiple sclerosis (right). Metabolite maps are overlaid on an MNI standard brain for reference. Representative integrated spectra in the right thalamus from one participant in each group are displayed, showing decreased NAA in the Multiple Sclerosis patient. CHO=choline, CR=creatine, MI=myo-inositol, NAA=N-Acetylaspartate, ppm=parts per million

