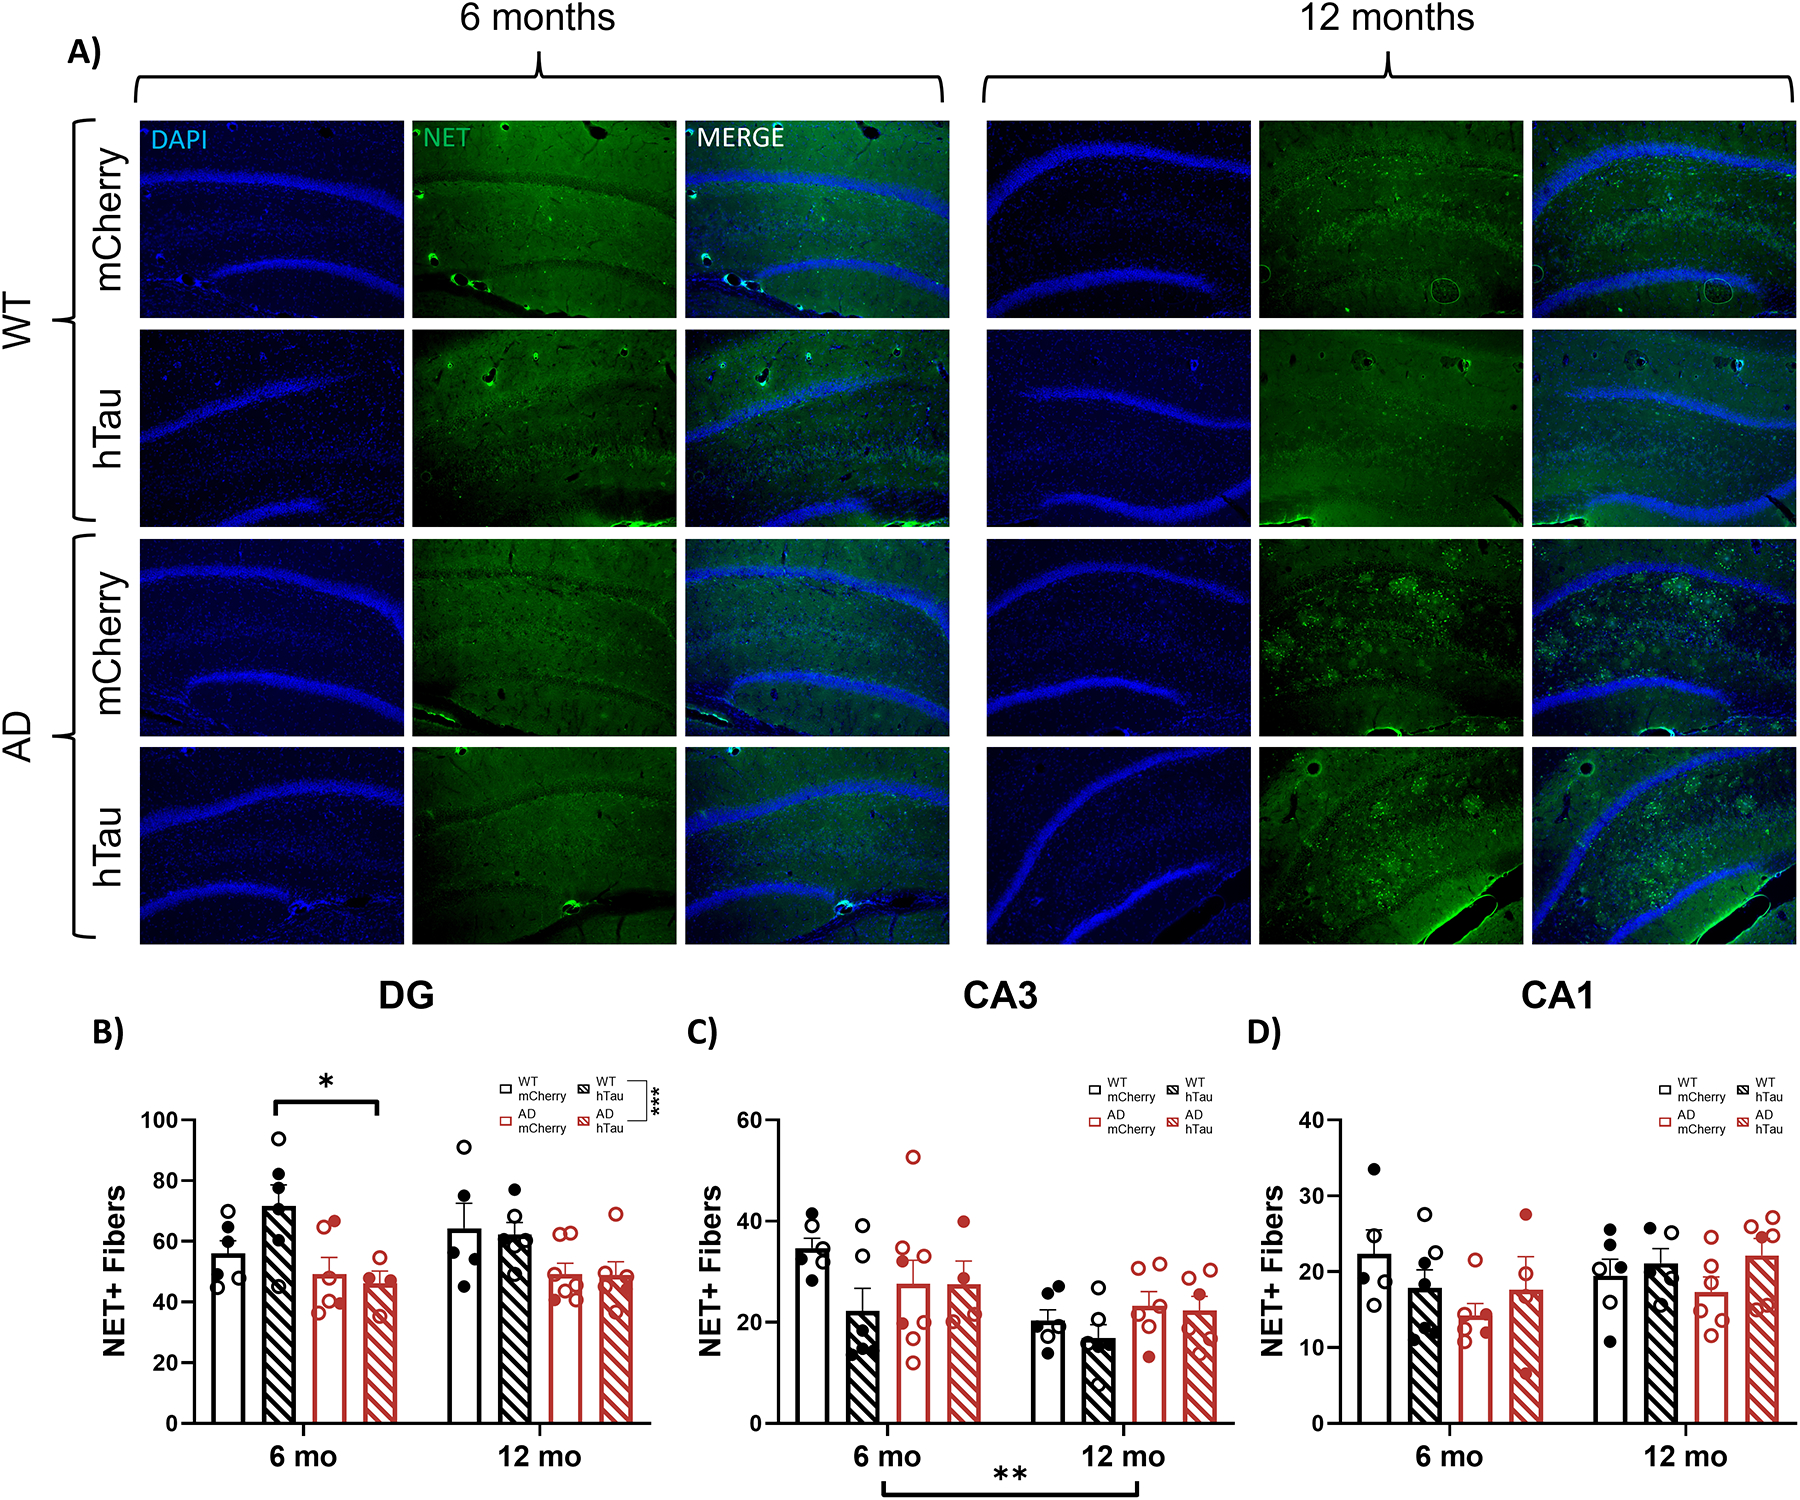
Fig. 10.

Assessment of LC fiber density in the hippocampus. Wild-type (WT, black) and TgF344-AD (AD, red) rats were injected bilaterally into the LC with AAV-PRSx8-hTau (hTau, hashed) or AAV-PRSx8-mCherry (mCherry, solid) at 2 months of age, and assessed for NET immunoreactivity at 6 months or 12 months. N = 4–8 per group. Shown are representative images in the DG subregion of the hippocampus (A), and quantification in the DG (B), CA3 (C), and CA1 (D) expressed as the number of NET+ fibers. (D). Main images and insets taken at 10x and 40x magnification, respectively. **p<0.01, ***p<0.001. Males are represented by closed circles, females by open circles.
