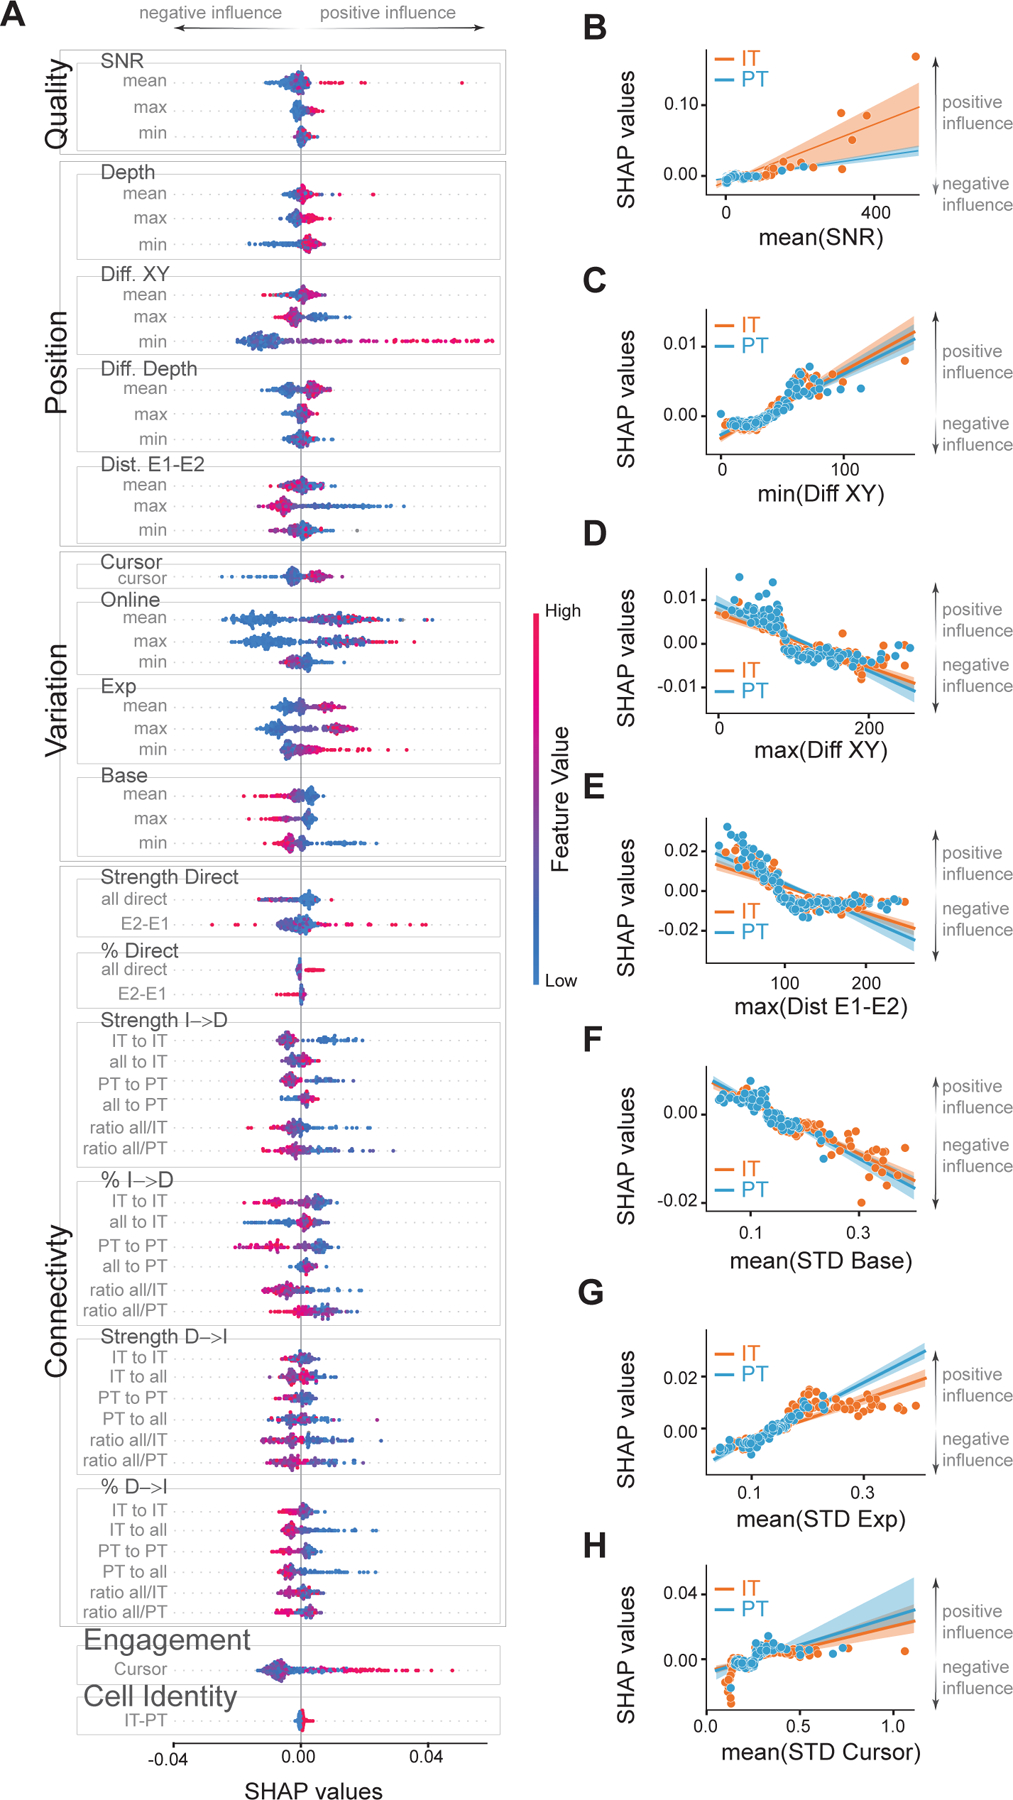
Figure 2: Dissecting the influence of features on learning outcome.

A) SHAP values for all the features used in the XGBoost models (see Figure S2 for description). Positive SHAP values indicate a positive effect on the PC measure and a better learning outcome. Negative SHAP values indicate a negative effect on learning. Features are divided into 6 groups: Quality, Position, Variation, Connectivity, Engagement and Cell Identity for clarity. Quality features are comprised of the signal-to-noise ratio. Position features include depth (Depth) of direct neurons, the distance between direct neurons on a plane (Diff. XY), their difference in depth (Diff. Depth), and the distance between neurons of the ensemble E1 and the ensemble E2 (Dist. E1-E2). Variation features include STD of the cursor (Cursor) based on neuronal activity E2-E1, STD of the online calcium signals that operated the CaBMI (Online), and also the post-processed calcium signals of direct neurons during baseline (Base) or during the whole experiment (Exp). Measures that were calculated for each direct neuron were included as features with their minimum (min), mean, or maximum (max) value. Color (red-to-blue) represent the value of the feature. Sessions from IT and PT groups were included. B-H) Linear regression between SHAP values and the value of mean SNR (B); minimum distance (C) and maximum distance (D) in the XY plane between 2 direct neurons; maximum distance between neurons belonging to different ensembles (E). Activity of direct neurons during baseline (F) or whole experiment (G). H) Mean of the STD of the neural cursor. Each dot represents 1 session. Shaded area is the confidence interval. Orange dots are sessions from the IT group whereas blue dots are sessions of the PT group. See also Figure S3.A–F for IT-PT differences of these features.
