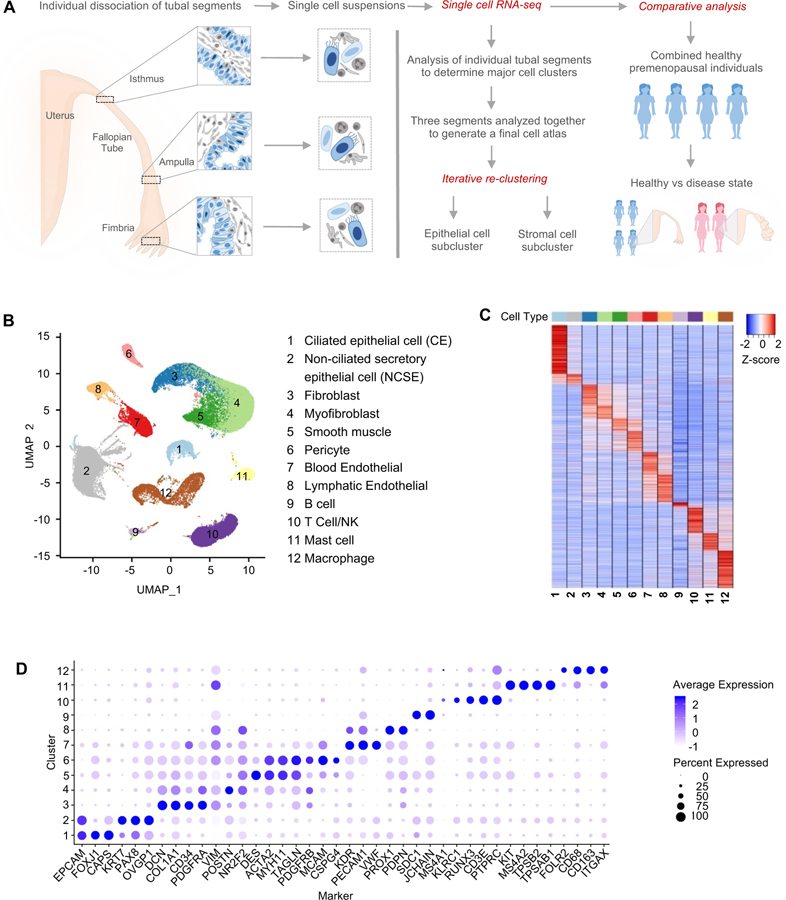
Figure 1. Major cell types and markers identified from single-cell RNA-Seq analysis of healthy human fallopian tubes.
A. Overview of the study, including the fallopian tube sections from which the samples were taken, and the data collection and analysis processes.
B. Identification of 12 major cell types from global clustering of cells from healthy subjects, visualized in UMAP space.
C. Marker gene expression pattern in the 12 major cell types, with values for each gene averaged within each cell type (i.e., the centroid), then standardized over the 12 centroids.
D. Average expression level and prevalence of selected markers used to annotate the 12 major fallopian tube cell types. Details are in Table S3.

