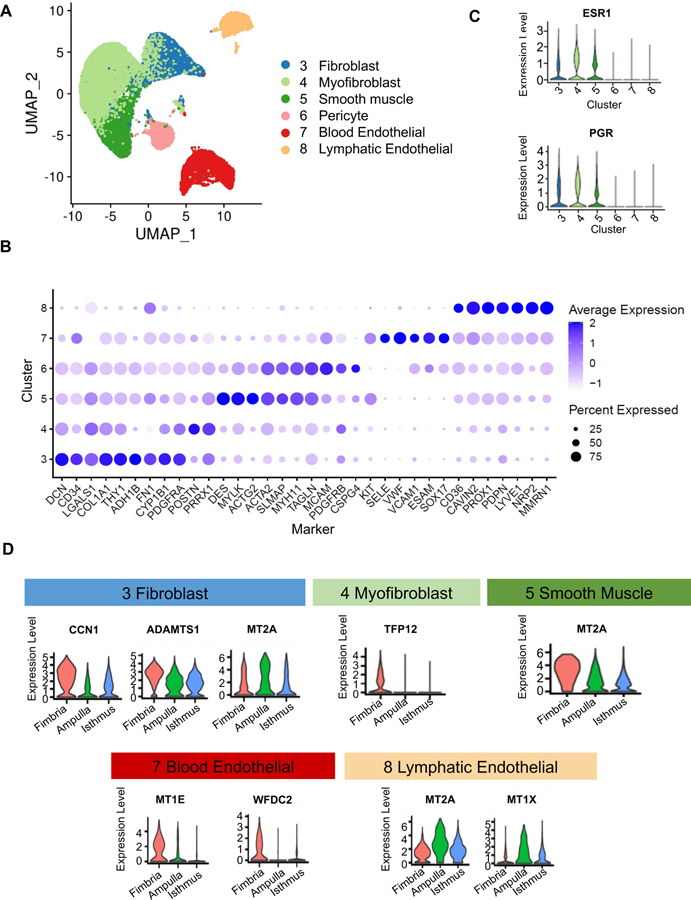
Figure 4: Stromal cell classification.
A. Visualization of 28,691 stromal cells in a UMAP projection of only the stromal cells, colored by the 6 stromal clusters from global clustering shown in Fig.1B
B. Average expression levels and prevalence of major markers used to annotate the stromal cell types.
C. Expression levels of genes encoding hormone receptors, ESR1 and PGR, in the 6 stromal cell types.
D. Expression levels of select markers differentially expressed across the three fallopian tube segments for different stromal clusters.

