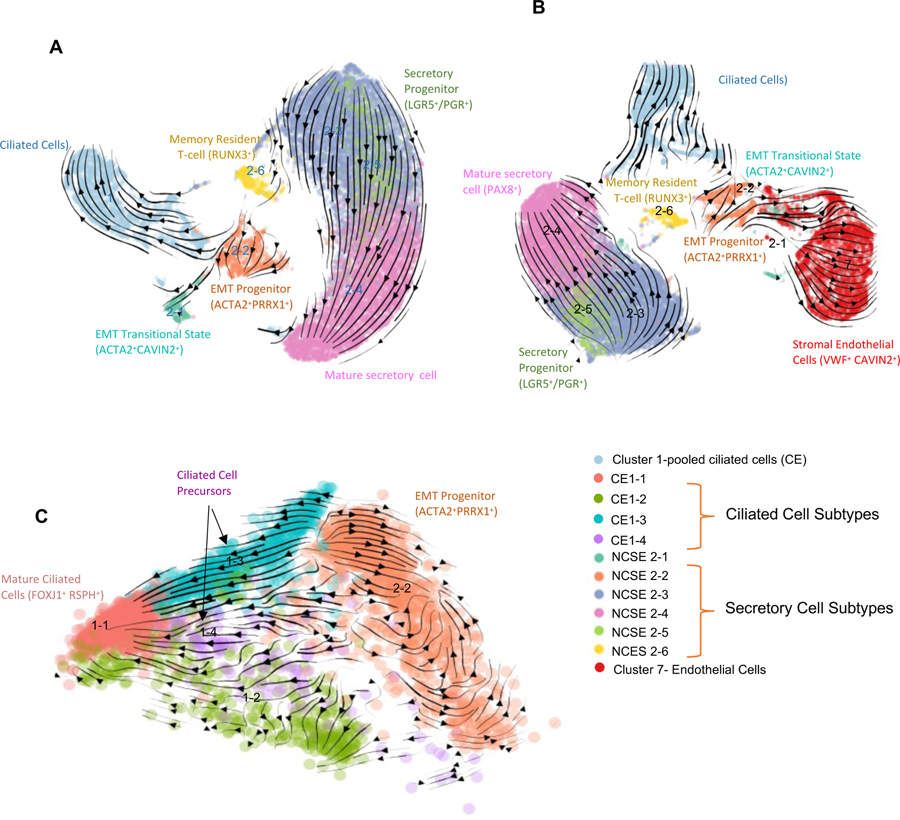
Figure 5. Velocity analysis that uncovers two potential progenitor populations.
A. Velocity plot for CE and 6 subtypes of NCSE in UMAP view. Similar results were found when running Velocity analysis for the 3 FT samples separately while using common UMAP projections (Figure S4C. see Methods).
B. Velocity plot for CE, 6 subtypes of NCSE, and Blood endothelial cells (global cluster 7) in UMAP view.
C. Velocity plot for 4 subtypes of CE and NCSE 2–2 in PCA view.
See also Figure S4.

