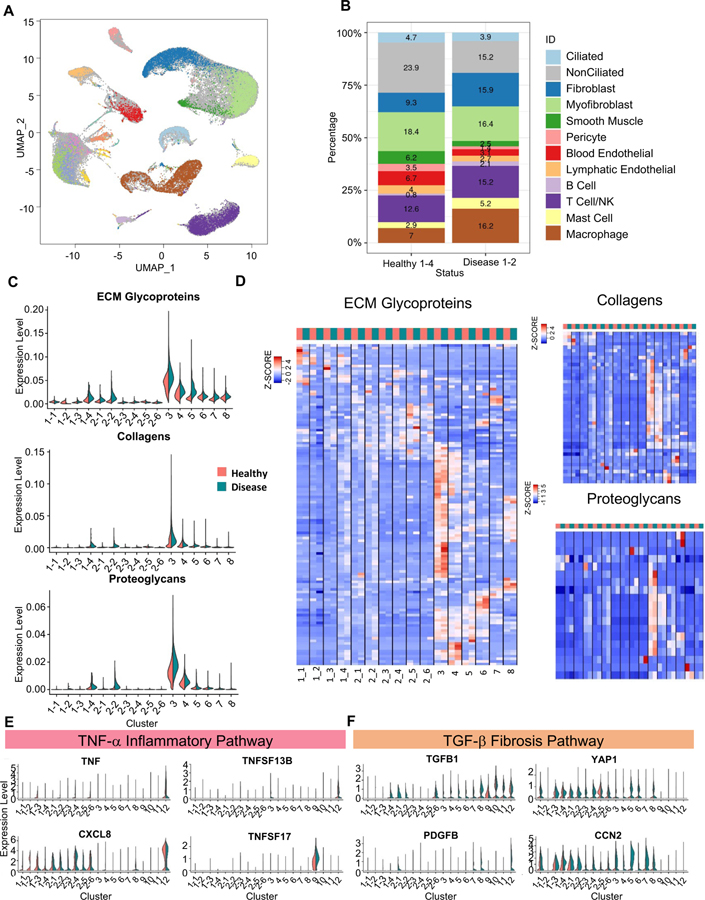
Figure 6: Comparison of epithelial and stromal populations between healthy and disease samples.
A. Visualization of cells from two diseased fallopian tube samples (FT5 and FT6) in a global UMAP projection, colored by supervised assignment of the FT5 and FT6 cells into clusters found for the healthy samples. Cells from healthy samples are colored as grey background.
B. Composition of the 12 cell types, compared between the 4 healthy samples and the 2 disease samples.
C. Expression level distribution of three ECM-related gene sets, for the 4 CE subtypes. 6 NCSE subtypes, and 6 stromal cell types, compared between healthy (red) and disease (blue) samples.
D. Heatmaps of expression levels of three sets of genes, for ECM glycoproteins, collagens, and proteoglycans, respectively, compared across cell types and between healthy (red) and disease (blue) samples. Average expression of each gene is calculated for each cell type (i.e., the centroid), then standardized over the centroids shown.
E, F. Expression levels of genes in TNFα pathway (E) and TGFβ pathway (F), compared across cell types and between healthy (red) and disease (blue) samples.
See also Figure S6, Table S2, Table S7, Table S8 and Table S9.

