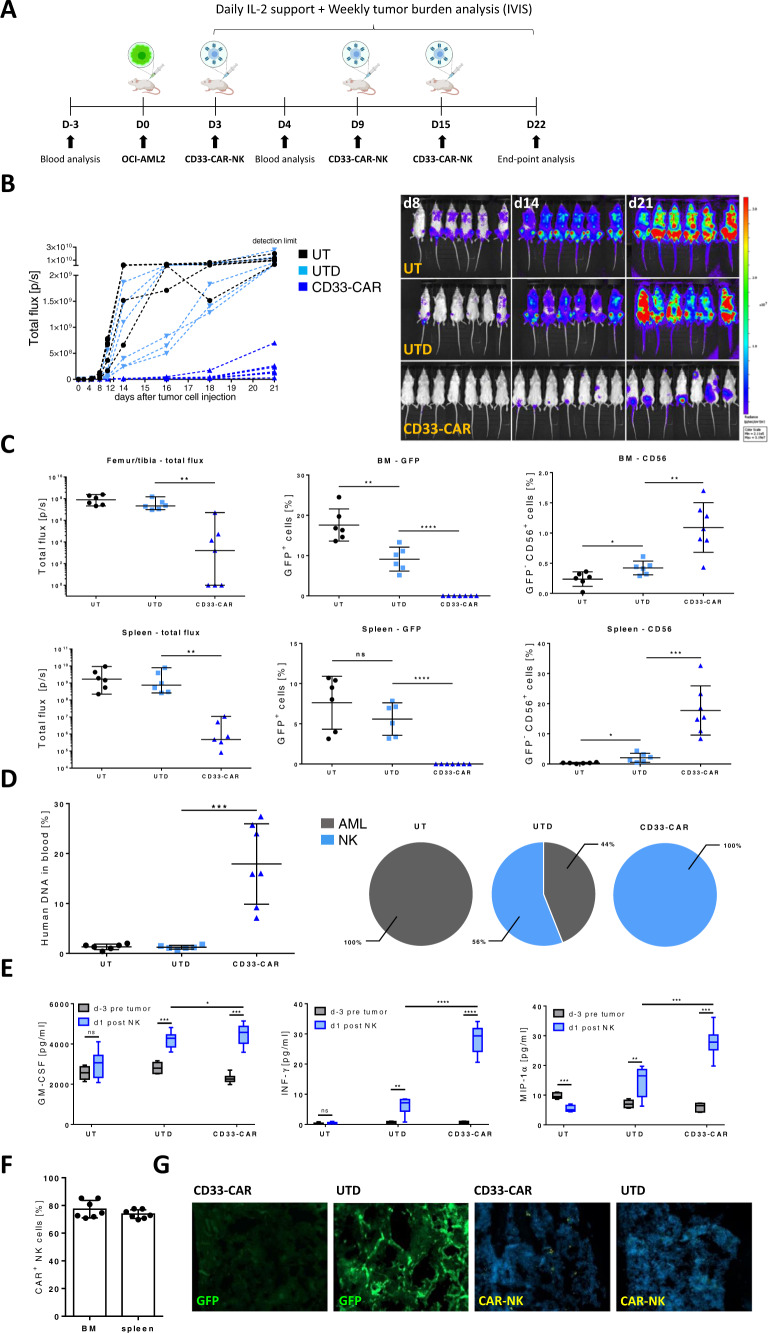
Fig. 3. Repetitive administration of CD33-CAR-NK cells displays improved anti-tumor efficacy in OCI-AML2 engrafted NSG-SGM3 mice.
A Scheme of the in vivo evaluation of a repetitive treatment with CD33-CAR-NK cells (1 × 10⁷ intravenously) combined with subcutaneous IL-2 treatment in OCI-AML2 (Luc+) xenograft NSG-SGM3 mice. B Total flux analysis, as well as representative BLI images of differently treated OCI-AML2 (Luc+), engrafted NSG-SGM3 mice over time (n = 7 per group). Mice received a total of three weekly doses of 1 × 10⁷ NK cells. Mice that were treated with CD33-CAR-NK cells show severely reduced leukemic burden compared to untreated mice (UT) or mice which received untransduced (UTD)-NK cells. C Total flux analysis of femurs/tibiae and spleens, as well as flow cytometry analysis of isolated cells from BMs or spleens at day 22 post AML-injection, revealed the absence of GFP-positive leukemic cells in CD33-CAR-NK treated mice as well as increased NK cell infiltration (n = 6–7 per group). Values of zero were set to 1 for total flux analysis. Median ± range. D Chimerism analysis d22 post AML-injection revealed high amounts of DNA from human NK cells without detectable DNA of AML in blood of mice that were treated with CD33-CAR-NK cells (n = 6–7 per group). Mean ± SD. E Serum analysis of blood day 3 before AML injection and day 1 post first NK cell application showed significantly increased pro-inflammatory human cytokines for mice that received CD33-CAR-NK cells (n = 6–7 per group). F Flow cytometry-based CAR-expression analysis of BM- or spleen-infiltrating NK cells in CD33-CAR-NK treated mice revealed the presence of mainly CAR-positive cells (n = 6–7 per group). Mean ± SD. G Confocal microscopy imaging demonstrated GFP-positive leukemia cells in BM of UTD-NK treated NSG-SGM3 mice while absent in mice that received CD33-CAR-NK cells. Additionally, CAR-NK cells could be detected in the BM of CD33-CAR-NK treated mice. One representative image from a total of four are shown. Statistical analysis was performed by Mann–Whitney-test (for total flux analysis) or Student’s t test (for the rest) (*P < 0.05, **P < 0.01, ***P < 0.001, ****P < 0.0001).

