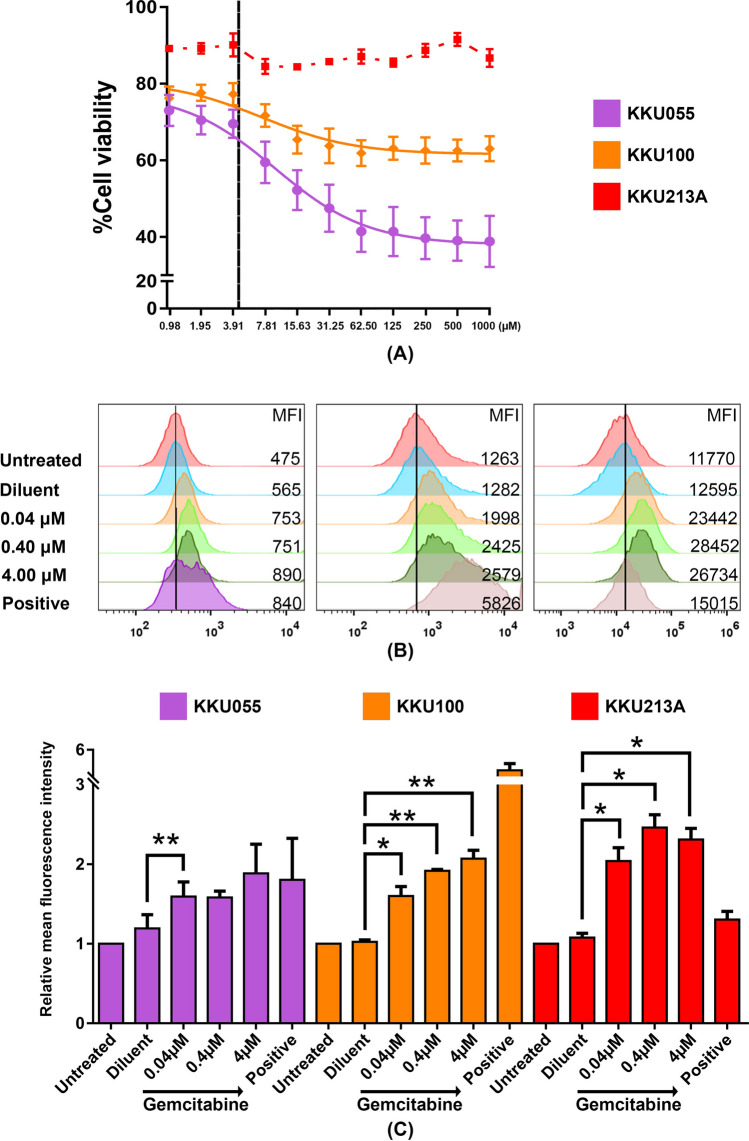
Figure 1.
Gemcitabine increased PD-L1 expression in CCA cell lines. (A) Cell viability of CCA cell lines after treatment with various concentrations of gemcitabine for 24 h. The vertical black line shows the selected concentration (4 µM) that caused low cytotoxicity to CCA cell lines. (B) The histograms and (C) bar graph of PD-L1 relative fluorescence intensity comparing to non-treatment control after treatment with gemcitabine for 24 h. Error bars represented the standard error of the mean (SEM) (*p < 0.05, **p < 0.01). Diluent (gemcitabine diluent: normal saline); Positive (IFN-γ 10 ng/mL).

