Figure 4.
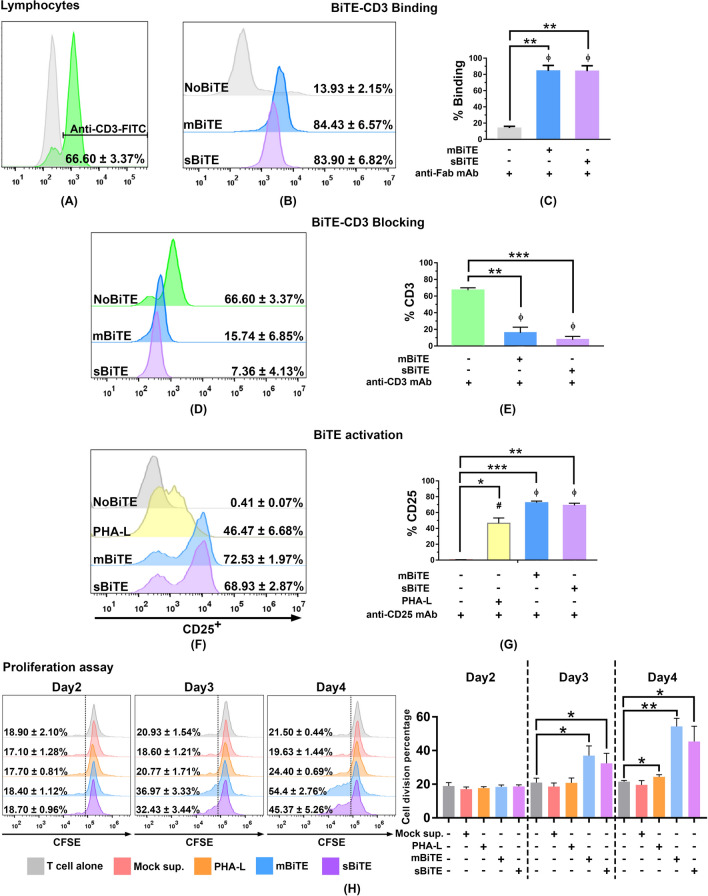
PD-L1xCD3 BiTE interacted to CD3 and activated T cells (A) CD3 positive lymphocyte population demonstrated as histogram. (B and C) The histogram showed the ability of mBiTE and sBiTE to directly bind to CD3 on T cells. The bar graph represents the % positive cells detected by anti-Fab mAb. (D and E) The histogram and bar graph showed % positive cells detected by anti-CD3 mAb after blocking with mBiTE and sBiTE (% blocking). (F and G) The histogram and bar graph showed % CD25 positive cells after 48 h of mBiTE and sBiTE treatment. (H) The histogram and bar graph demonstrated the activity of mBiTE and sBiTE to promote T cell proliferation after Day2-Day4 after treatment accessed by CFSE proliferation assay. Data are presented as the mean ± standard error or the mean (SEM) (*p < 0.05, **p < 0.01, ***p < 0.001).

