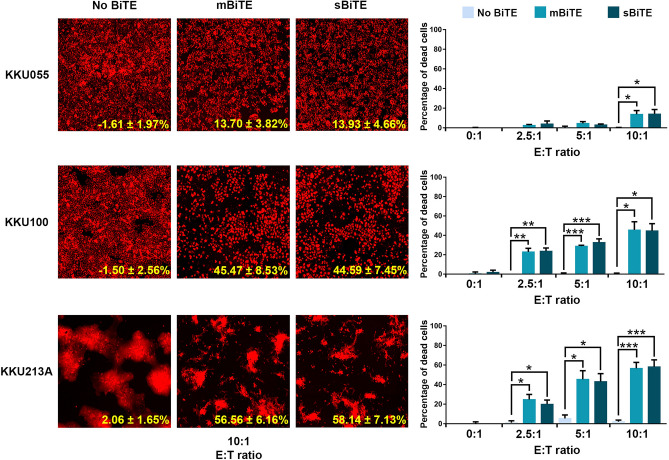
Figure 5.
The effect of BiTEs on the induction of T cell cytotoxicity against CCA cells. A killing assay was performed to determine the number of remaining mCherry-expressing CCA cells after coculturing of T cells in the presence or absence of mBiTE or sBiTE. The remaining cells were observed after 24 h of coculturing under the florescence microscope at an E:T ratio of 10:1 (left). The bar graph showed the percentage of cell death relative to non-treatment control at E:T ratios of 0:1, 2.5:1, 5:1, and 10:1 (right). Data are presented as the mean ± standard error of the mean (SEM) (error bar) (*p < 0.05; **p < 0.01; ***p < 0.001).

