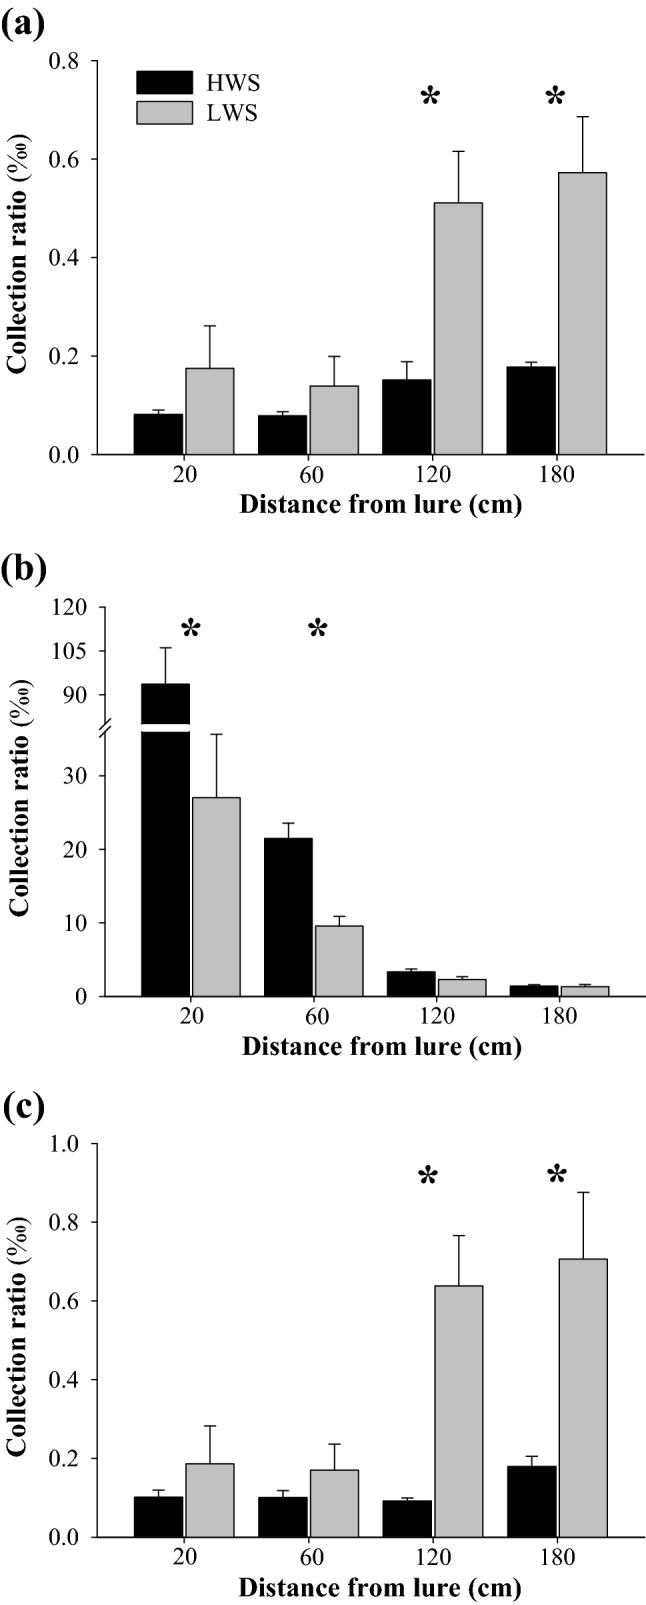
Figure 2.

Collection ratios of total amounts of collected volatiles at different points in the wind tunnel under low and high wind speed. Collection ratio = (amount collected at a point/amount released from the source) × ‰. (a)–(c) indicate, respectively, left, middle and right, and are the horizontal position of the collection points compared with odor source. Value on abscissa indicates vertical position of the collection points from source odor in the downwind direction. HWS, high wind speed; LWS, low wind speed. Data are mean + SE (n = 4). Asterisks denote significant difference in collection ratio at a particular point between low and high wind speed (two-sample t-test for means: P < 0.05).
