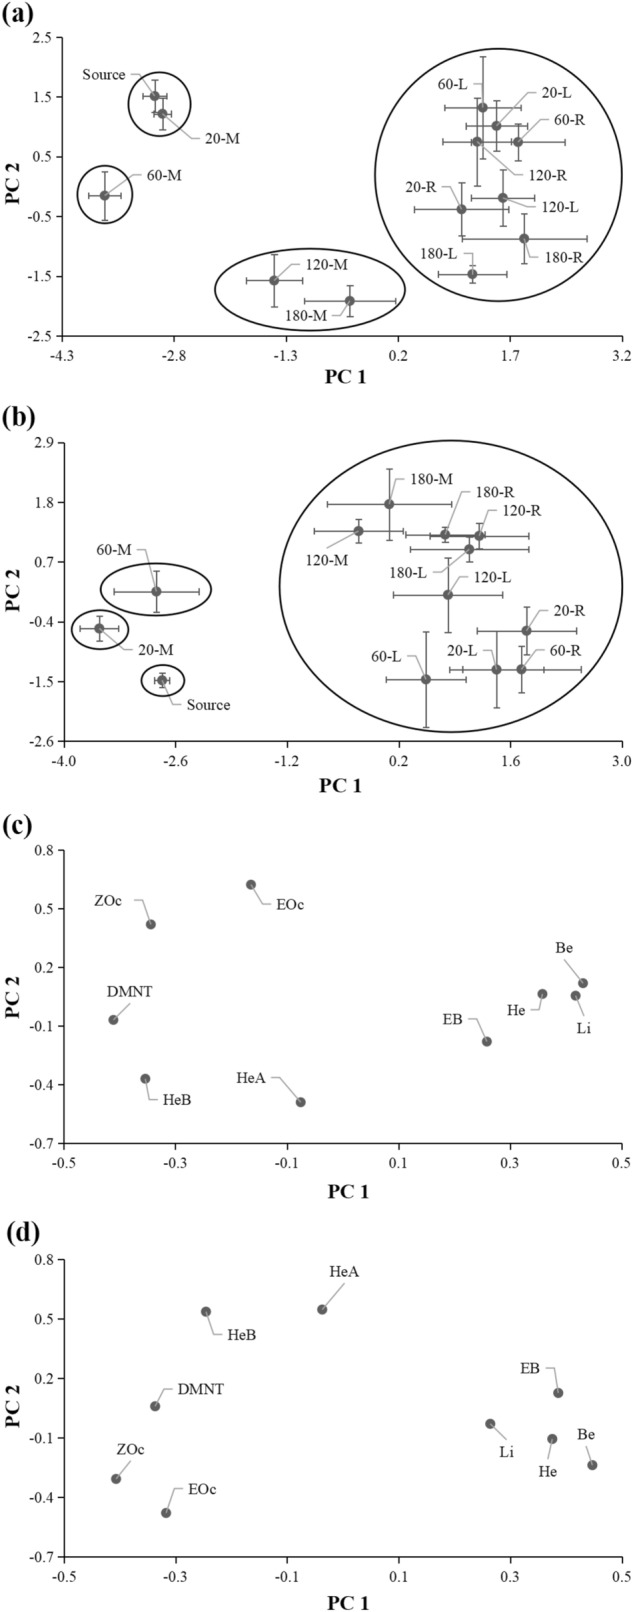
Figure 5.

Principal component analysis (PCA) of profiles of volatiles released from the odor source and those collected at 12 points in the wind tunnel under high (a score plot; c loading plot) and low (b score plot; d loading plot) wind speed. L, M, and R indicate, respectively, left, middle and right, and these are the horizontal position of the collection points compared with the odor source. 20, 60, 120, and 180 indicate, respectively, 20 cm, 60 cm, 120 cm, and 180 cm vertical distance of collection point from odor source in the downwind direction. Source indicates the odor source. Nine compounds were as follows: (Z)-3-hexenol (He), (Z)-3-hexenyl acetate (HeA), (Z)-3-hexenyl butyrate (HeB), benzaldehyde (Be), ethyl benzoate (EB), limonene (Li), (E)-β-ocimene (EOc), (Z)-β-ocimene (ZOc), and (E)-4,8-dimethyl-1,3,7-nonatriene (DMNT). Score plots from PCA are based on percentages of compounds out of total collected or released volatiles. Data points in the score plot are mean ± SE of principal component scores for four replicates.
