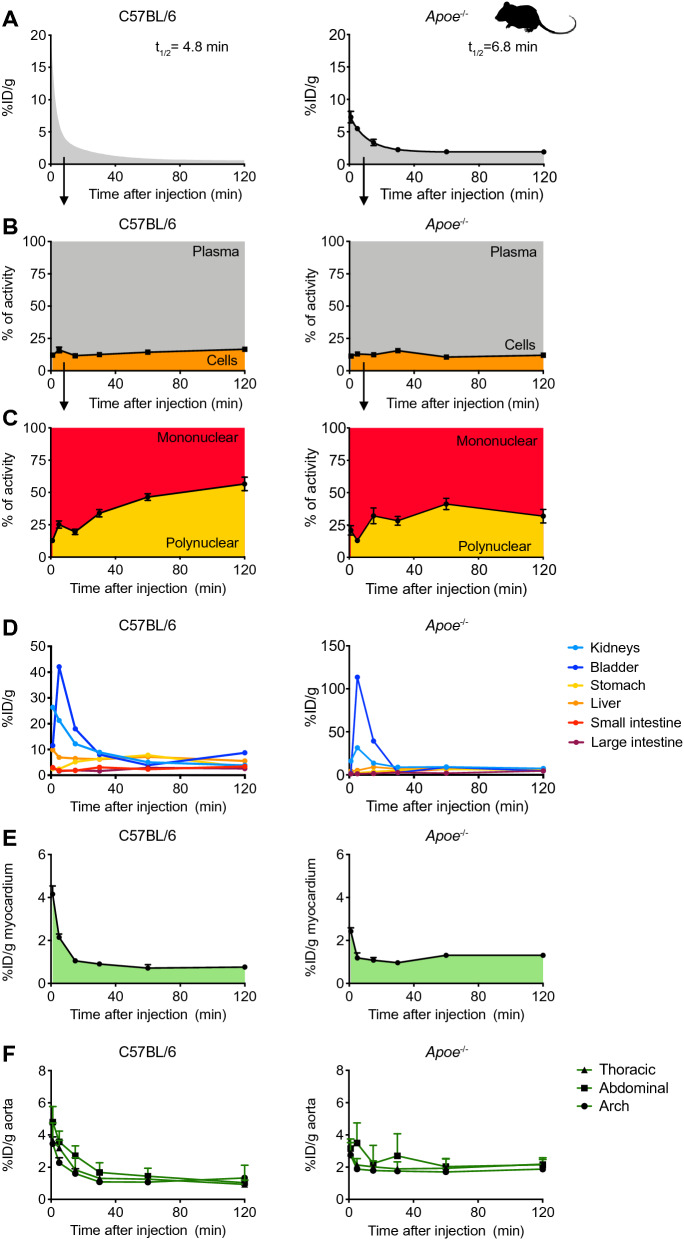
Figure 2.
[64Cu]Cu-DOTATATE pharmacokinetics and biodistribution in mice. (A) Blood time-activity curve for intravenously infused [64Cu]Cu-DOTATATE in C57Bl/6 (left) and Apoe−/− (right) mice. Data are presented as mean ± standard error of the mean. C57Bl/6 N = 7 and Apoe−/− N = 6. (B) [64Cu]Cu-DOTATATE radioactivity distribution in blood fractions as measured by gamma counting. Graphs show the percentage of activity associated with cells or plasma. Data are presented as mean ± standard error of the mean. N = 5 per group. (C) Percentage of activity associated with blood mononuclear or polynuclear cells. Data are presented as mean ± standard error of the mean. N = 5 per group. (D) Time-activity curves for [64Cu]Cu-DOTATATE in clearance organs. N = 5 per group. (E) Gamma counting of [64Cu]Cu-DOTATATE activity in the myocardium over time. Data are presented as median (interquartile range). C57Bl/6 N = 5 and Apoe−/− N = 4. (F) Time-activity curves for [64Cu]Cu-DOTATATE in the arch, thoracic and abdominal aorta. Data are presented as median (interquartile range). N = 5 per group. ID: injected dose; t1/2: half-life.

