Figure 4.
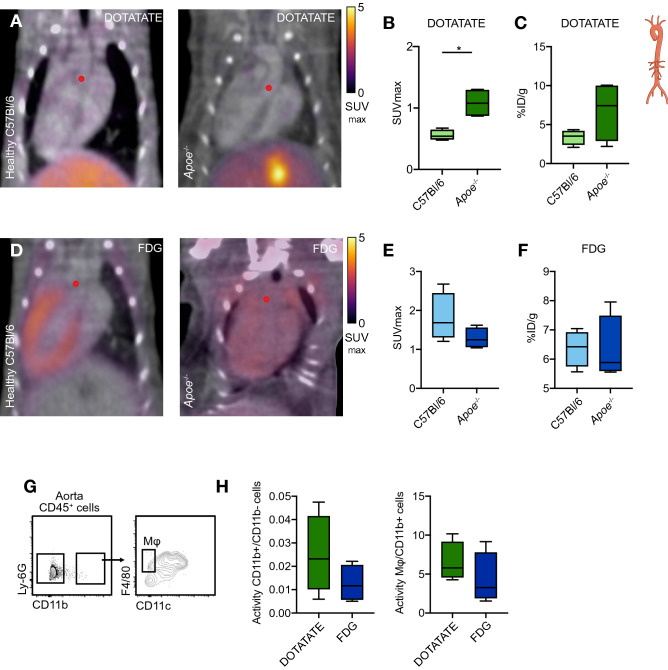
[64Cu]Cu-DOTATATE PET imaging of murine atherosclerosis. (A) Representative fused PET/CT image of [64Cu]Cu-DOTATATE-infused C57Bl/6 (left) and Apoe−/− mice after 12 weeks on WD (right). Red dot represents origin of ascending aorta. (B) In vivo [64Cu]Cu-DOTATATE SUVmax of the ascending aorta. N = 4 per group. (C) Ex vivo %ID/g of the whole aorta. N = 4 per group. (D) Representative fused PET/CT 3D-rendered image of [18F]F-FDG-infused Apoe−/− mice. Red dot represents origin of ascending aorta. (E) [18F]F-FDG SUVmax of ascending aorta. N = 4 per group. (F) %ID/g of the whole aorta. N = 4 per group. (G) Representative flow cytometry plots identifying CD11b+ and macrophage cell populations in the aorta. (H) Quantification of activity per cell in the aorta. Data are expressed as ratio of CD11b+/CD11b− (left) and Mφ/CD11b+ cell activity (right). N = 4 per group. DOTATATE: [64Cu]Cu-DOTATATE; FDG: [18F]F-FDG; ID: injected dose; Mφ: macrophages; SUVmax: maximum standardized uptake value. CD11b+ cells represent CD11b+CD11chi, excluding macrophage population. *p < 0.05. Data are presented as median (interquartile range).

