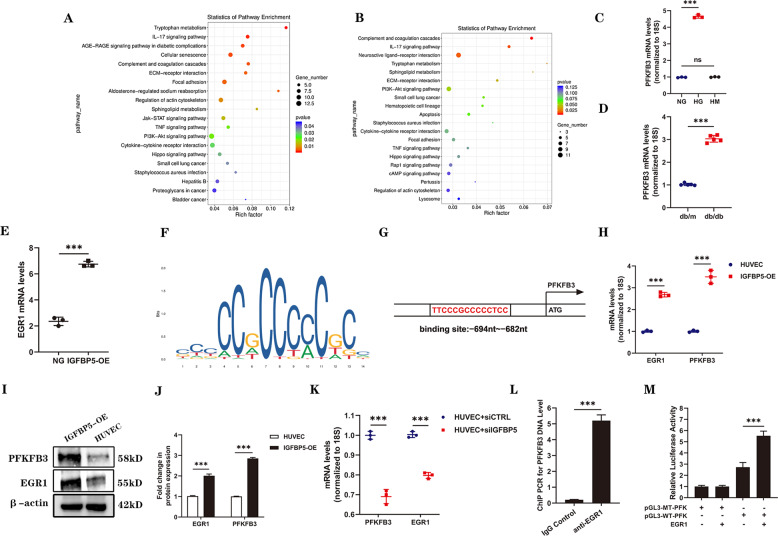
Fig. 3. IGFBP5 regulates the expression of PFKFB3 by regulating the binding EGR1 of to PFKFB3.
RNA-seq analysis was performed on IGFBP5-OE- and HG-stimulated HUVECs. A KEGG pathway analysis of upregulated signaling pathways in IGFBP5-OE cells. B KEGG pathway analysis of upregulated signaling pathways in HG-stimulated HUVECs. C, D RT–PCR analysis of the mRNA levels of PFKFB3 in HG-treated HUVECs and the kidneys of db/db or db/m mice. n = 3. E RNA-sequencing data of EGR1 expression in IGFBP5-OE cells. n = 3. F The consensus EGR1-binding motif identified by WebLogo in the EGR1 ChIP-Seq data. G The target region of the PFKFB3 promoter to which EGR1 binds. H RT–PCR analysis of EGR1 and PFKFB3 mRNA levels in IGFBP5-OE cells. n = 3. I, J Western blot analysis and densitometric quantification of EGR1 and PFKFB3 protein levels in IGFBP5-OE cells under NG conditions. n = 3. K RT–PCR analysis of EGR1 and PFKFB3 mRNA levels in HUVECs transfected with siIGFBP5 under HG conditions. L ChIP-PCR results for PFKFB3. n = 3. M Dual-luciferase reporter assay results. n = 3. The data are shown as the mean ± SD. ***P < 0.001; ns, no significance.

