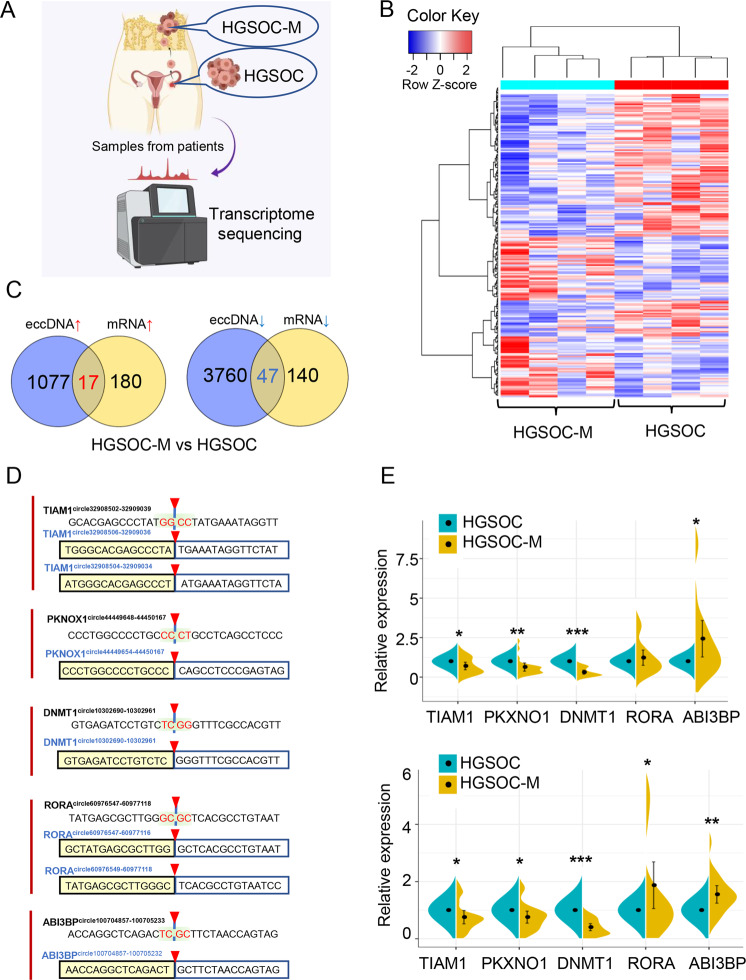
Fig. 4. Validations of the differentially expressed eccDNAs in primary and metastatic tissues of HGSOC samples.
A Flowchart illustrating the transcriptome analysis of paired primary and metastatic tissues of HGSOC (HGSOC 1-4 and HGSOC-M 1-4). B Clustered heatmap of differentially expressed mRNA in paired primary and metastatic tissues of four HGSOC patients. Red, up-regulation; Blue, down-regulation. C Venn diagrams showing the overlap of all differentially expressed mRNAs and eccDNAs of the same host gene. Left, up-regulated targets in both sequencing; Right, down-regulated targets in both sequencing. D Sanger sequencing results of PCR products of 15 bases on either side of junctions of eccDNAs derived from TIAM1, PKNOX1, DNMT1, ABI3BP and RORA,were listed in boxes, respectively. Black (upper) indicated the junction sequences of each eccDNA by Circle-Seq, with shaded (red) sequences depicting junction sites. Blue (lower) indicated the accurate circularization sites of each eccDNA based on Sanger sequencing results. E qPCR validations of 5 differentially expressed mRNAs (upper panel), and differentially expressed eccDNAs (lower panel) in 20 clinical HGSOC tissue samples containing 20 primary tissue samples (blue, HGSOC) and paired metastatic tissue samples (yellow, HGSOC-M). The data of the expression levels were shown as mean ± SD. *P < 0.05, **P < 0.01, ***P < 0.001.

