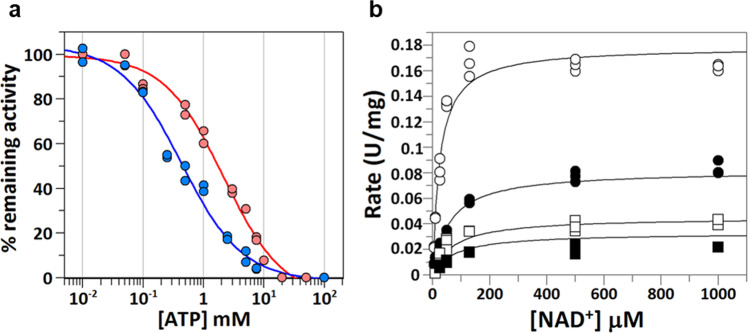
Fig. 7. Inhibition kinetics of ATP against ALDH1A3.
a Sigmoidal plots to determine IC50 values. The ALDH1A3 activity was assayed in 50 mM HEPES, 5 mM DTT, pH 8.0, without MgCl2 (blue curve) or including 30 mM MgCl2 (red curve). Hexanal was used as a substrate at saturating concentration (250 µM). NAD+ concentration was 24 µM in the absence of MgCl2, and 130 µM with 30 mM MgCl2. Experimental values with all replicate points are shown. n = 2, technical replicates for each ATP concentration (0.01–100 mM). b Michaelis-Menten plots fitted to the equation for mixed inhibition (Eq. 1). ATP concentrations (mM): 0.0 (empty circles), 2.0 (solid circles), 5.0 (empty squares) and 7.5 (solid squares). Hexanal was used as a substrate at a saturating concentration (250 µM). The values of kinetic parameters from this fit were: Vmax = 0.18 ± 0.01 U/mg; Km = 24 ± 2 µM; Ki = 0.48 ± 0.08 mM; Ki’ = 1.68 ± 0.12 mM. Experimental values with all replicate points are shown. n = 3, technical replicates for each NAD+ concentration (5–1000 µM). Parameter values are expressed as the calculated value ± standard error.

