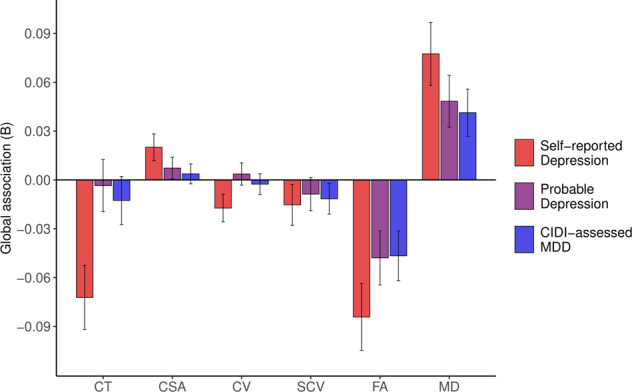
Fig. 1. Associations between lifetime depression phenotypes and global structural brain metrics.

Notes. CIDI = Composite International Diagnostic Interview (short form); MDD = Major Depressive Disorder; CT = global mean cortical thickness; CSA = total cortical surface area; CV = total cortical volume; SCV = total subcortical volume; FA = global mean fractional anisotropy; MD = global mean diffusivity. Bars represent β coefficients for global metric associations with Self-reported Depression (red), Probable Depression (purple) and CIDI-assessed MDD (blue); error bars represent the standard error of the estimated coefficient.
