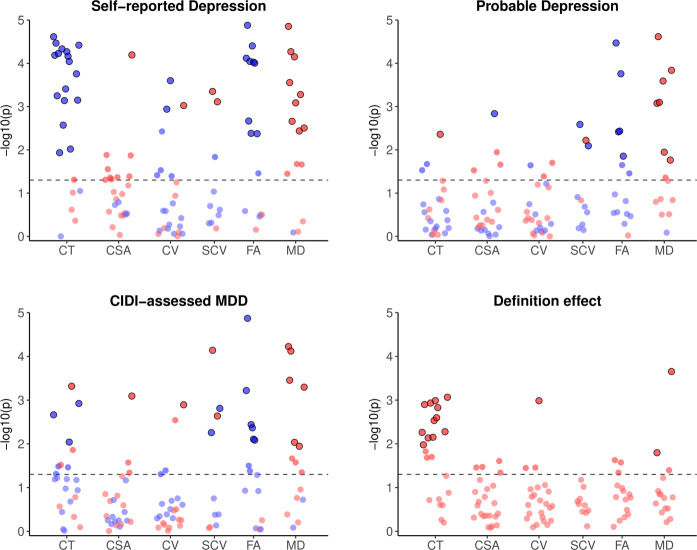
Fig. 2. Significance of associations between lifetime depression phenotypes and individual cortical, subcortical and white matter metrics, and effects of phenotype definition on these associations.
Notes. CIDI = Composite International Diagnostic Interview (short form); MDD = Major Depressive Disorder; CT = cortical thickness; CSA = cortical surface area; CV = cortical volume; SCV = subcortical volume; FA = fractional anisotropy; MD = mean diffusivity. Phenotype effects for each metric represent the difference, assessed using z-tests, between the two most disparate of the β coefficients for the three phenotypes’ associations with that metric. Red and blue points represent positive and negative associations, respectively. Horizontal dashed lines represent p = 0.05; outlined points represent associations that remained significant following FDR correction. β coefficients for all plotted results are reported in Supplementary Materials (Tables S3–S8).

