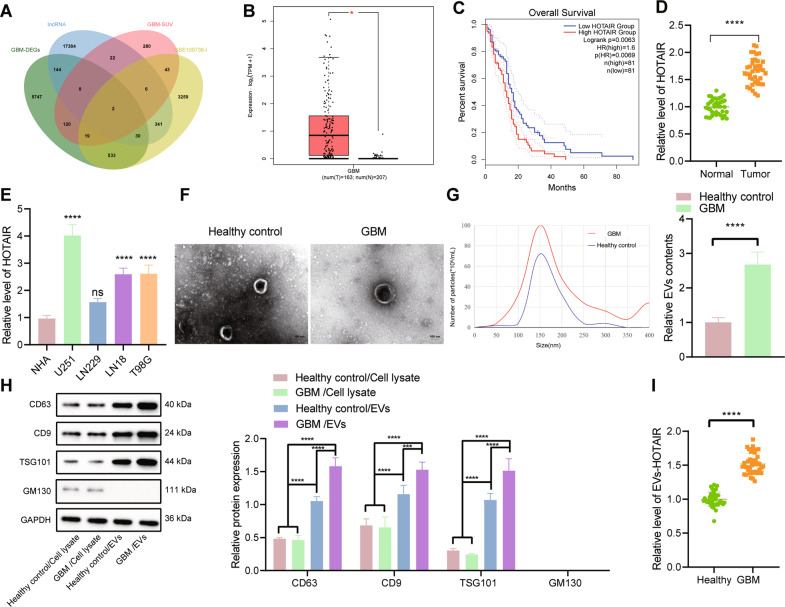
Fig. 1. HOTAIR is upregulated in clinical tissues, cells, and serum-EVs of GBM.
A Venn diagram of upregulated genes from the GEPIA database, the top 500 survival-related genes, upregulated lncRNAs from the GSE100736 data set, and human lncRNA names from the GENCODE database. B A box plot of HOTAIR expression in TCGA-GBM. The red box on the left indicates GBM samples, and the gray box on the right indicates normal samples. *p < 0.05. C Correlation analysis of HOTAIR expression with the overall survival of GBM patients in TCGA-GBM. D RT-qPCR detection of HOTAIR expression in normal brain tissues (n = 40) and GBM tissues (n = 40). ****p < 0.0001. E RT-qPCR detection of HOTAIR expression in GBM cell lines and human primary astrocytes NHA. ****p < 0.0001, ns, not significant, compared with NHA cells. F Morphology of serum-EVs of GBM patients (n = 40) and healthy controls (n = 40) observed under a TEM. G Graph (left panel) and quantification (right panel) of NTA results of the size distribution and relative concentration of serum-EVs of GBM patients (n = 40) and healthy controls (n = 40), ****p < 0.0001. H Western blot analysis of CD63, CD9, TSG101, and GM130 proteins in the serum-EVs of GBM patients (n = 40) and healthy controls (n = 40). I RT-qPCR detection of HOTAIR expression in serum-EVs of GBM patients (n = 40) and healthy controls (n = 40). ****p < 0.0001. Each experiment was repeated three times independently.

