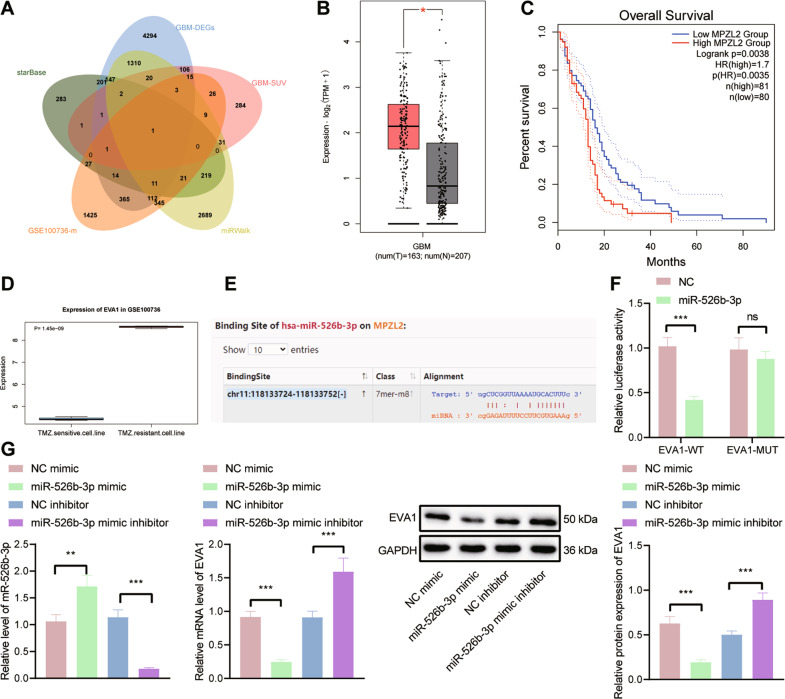
Fig. 4. EVA1 is a target gene of miR-526b-3p.
A Venn diagram of downstream genes of miR-526b-3p predicted by the starBase and miRWalk databases, the top 500 survival-related genes, and TMZ resistance-related genes from the GSE100736 data set. B A box plot of EVA1 expression in TCGA-GBM. The red box on the left indicates GBM samples, and the gray box on the right indicates normal samples. C Correlation analysis of EVA1 expression with the overall survival of GBM patients in TCGA-GBM. D EVA1 expression in the TMZ resistance-related GSE100736 data set. E The predicted binding sites between miR-526b-3p and EVA1 by the starBase database. F Binding of miR-526b-3p to EVA1 confirmed by dual-luciferase reporter assay. G RT-qPCR and western blot analysis detection of EVA1 expression in U251 cells transfected with miR-526b-3p mimic or miR-526b-3p inhibitor. *p < 0.05, **p < 0.01, or ***p < 0.001. ns indicates no significant difference between the two groups. Each experiment was repeated three times independently.

