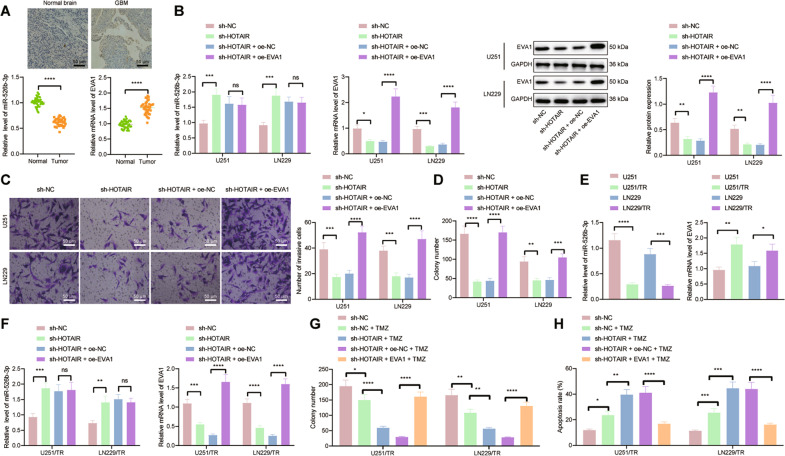
Fig. 5. HOTAIR accelerates GBM progression and increases TMZ resistance by regulating the miR-526b-3p/EVA1 axis.
A miR-526b-3p expression detected by RT-qPCR and EVA1 mRNA and positive expression detected by RT-qPCR and immunohistochemistry in clinical tissues of GBM patients (n = 40) and normal brain tissues (n = 40). *p < 0.05, compared with normal brain tissues. B miR-526b-3p expression detected by RT-qPCR and EVA1 mRNA and protein expression detected by RT-qPCR and western blot analysis in U251 and LN229 cells treated with sh-HOTAIR or combined with oe-EVA1. C Invasion of U251 and LN229 cells treated with sh-HOTAIR or combined with oe-EVA1 measured by Transwell assay. D Colony formation of U251 and LN229 cells treated with sh-HOTAIR or combined with oe-EVA1 measured by colony formation assay. E RT-qPCR detection of miR-526b-3p and EVA1 expression in U251/TR and LN229/TR cells as well as parental cells U251 and LN229. F RT-qPCR detection of miR-526b-3p and EVA1 expression in U251/TR and LN229/TR cells treated with sh-HOTAIR or combined with oe-EVA1. G Colony formation of U251/TR and LN229/TR cells treated with sh-HOTAIR or combined with oe-EVA1 measured by colony formation assay. H Flow cytometric analysis of U251/TR and LN229/TR cell apoptosis upon treatment with sh-HOTAIR or combined with oe-EVA1. *p < 0.05, **p < 0.01, ***p < 0.001, or ****p < 0.0001. ns indicates no significant difference between the two groups. Each experiment was repeated three times independently.

