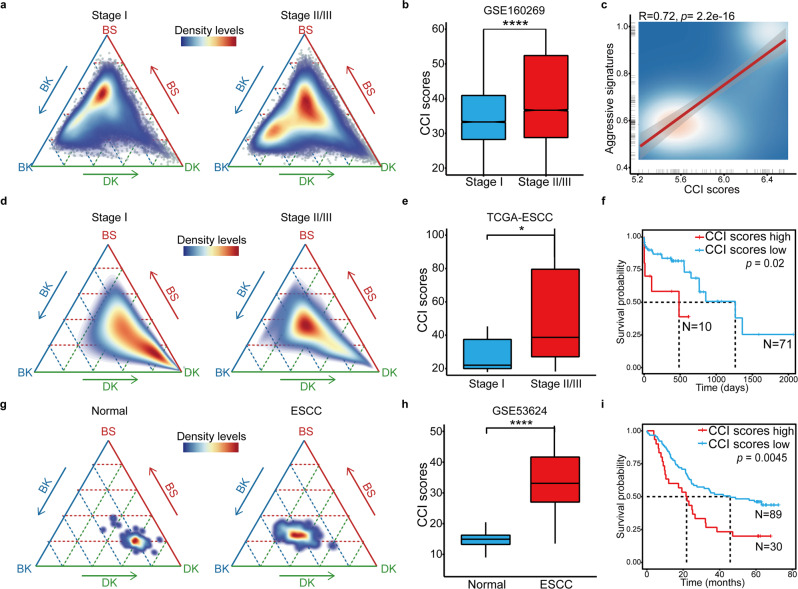
Fig. 2.
CCI is an independent prognostic marker in ESCC. a The ternary diagram showed the similarity/variation in stage I (left) and stage II/III (right) from scRNA-seq data of GSE160269, with BS, BK, and DK cells. The color represented the density levels of distribution. b The boxplot showed the CCI scores in stage I and stage II/III patients from GSE160269 (n = 13,041 cells, Stage I; n = 31,506 cells, Stage II/III). p Values calculated by Wilcoxon signed-rank test. ****p < 0.0001. c The scatter plot showed the correlation between the CCI scores and the expression levels of ESCC aggressive stage-specific signatures in scRNA-seq. d The ternary diagram showed the similarity/variation in stage I (left) and stage II/III (right) from bulk RNA-sea data of TCGA-ESCC, with BS, BK, and DK cells. The color represented the density levels of distribution. e The boxplot showed the CCI scores in stage I and stage II/III patients from TCGA-ESCC (n = 7 patients, Stage I; n = 72 patients, Stage II/III). p Values calculated by two-sided unpaired t-test. *p < 0.05. f The Kaplan–Meier survival curves of TCGA-ESCC patients with low and high CCI scores. g The ternary diagram showed the similarity/variation in adjacent normal (left) and ESCC (right) from array data of GSE53624, with BS, BK, and DK cells. The color represented the density levels of distribution. h The boxplot showed the CCI scores in adjacent normal and ESCC samples from GSE53624 (n = 119 patients, normal; n = 119 patients, ESCC). p Values calculated by Wilcoxon signed-rank test. ****p < 0.0001. i The Kaplan–Meier survival curves of GSE53624 patients with low and high CCI scores

