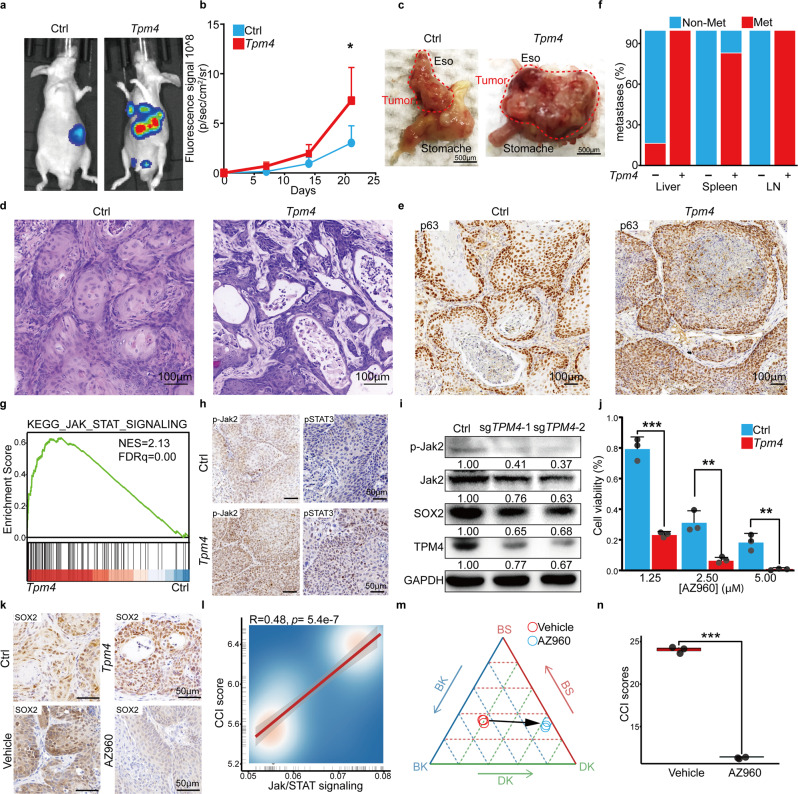
Fig. 4.
TPM4 promotes CCI and ESCC aggressiveness through the Jak/STAT pathway. a Representative living images after orthotopic transplantation of control (left) and Tpm4 (right) overexpressed tumor organoids, each group consisting of six mice. b The luciferase fluorescence signal intensity of the control and Tpm4 overexpressed mice after orthotopic transplantation. Data shows the means ± SEM. (n = 6 independent biological replicates were performed for each group). p Values calculated by two-sided unpaired t-test. *, p < 0.05. c Representative bright-field images of the orthotopic esophageal tumor tissue derived from the control (left) and Tpm4 overexpressed (right). Scale bar, 500 μm. d Representative H&E staining images of primary orthotopic tumors derived from the control (left) and Tpm4 overexpressed (right). Scale bar, 100 μm. e Representative immunohistochemistry images of p63 in orthotopic control and Tpm4 overexpressed tumors. Scale bar, 100 μm. f The percentages of the control or Tpm4 overexpressed mice with indicated numbers of metastases in liver, spleen, and lymph nodes (LN) were summarized. (Each group consists of n = 6 mice). g The GSEA plot showed the Jak/STAT signaling pathways enriched in Tpm4 overexpressed samples. h Representative immunohistochemistry images of p-Jak2 and pSTAT3 in subcutaneous control and Tpm4 tumors. Scale bar, 50 μm. i The representative western blotting pictures showed the p-Jak2, Jak2, SOX2, TPM4, and GAPDH levels in the control or TPM4 disrupted organoids. j The viability of control and Tpm4 overexpressed tumor organoids in different concentrations of AZ960. Data are shown as mean ± SD. (n = 3 independent biological replicates were performed for each group). p Values calculated by two-sided unpaired t-test. **p < 0.01; ***p < 0.001. k Representative immunohistochemistry images of SOX2 in subcutaneous control and Tpm4 overexpressed tumors (top) and in subcutaneous Tpm4 overexpressed tumors treated with vehicle and AZ960 (bottom). Scale bar, 50 μm. l The scatter plot showed the correlation between the expression levels of Jak/STAT and CCI scores in scRNA. m The ternary diagram showed the similarity/variation in RNA-seq data of Tpm4 overexpressed organoids treated with vehicle and AZ960, with BS, BK, and DK cells. Three independent biological replicates were performed for each group. n The boxplot showed the CCI scores in Tpm4 overexpressed organoids treated with vehicle and AZ960 (n = 3 organoids, Vehicle; n = 3 organoids, AZ960). Three independent biological replicates were performed for each group. p Values calculated by two-sided unpaired t-test. ***p < 0.001

