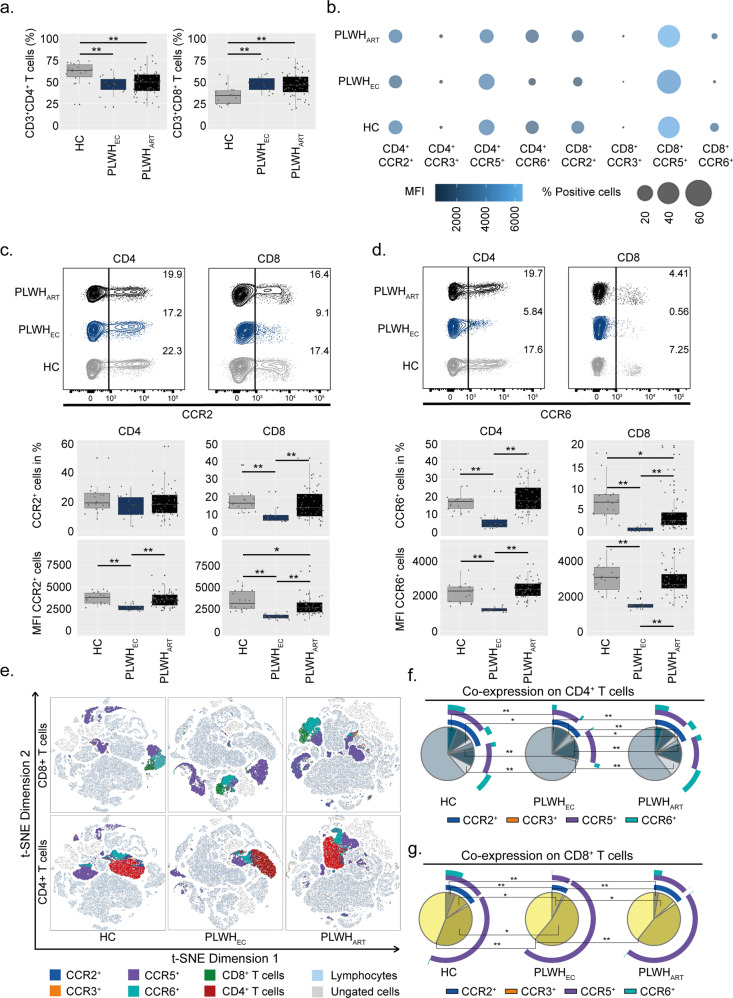
Fig. 1. CCR2 and CCR6 are specifically depleted from T lymphocytes in PLWHEC.
Receptor expression on CD4+ and CD8+ T lymphocytes from PLWHEC (n = 14), PLWHART (n = 54) and HC (n = 18). a Frequencies of CD4+ T cells and CD8+ T cells in total peripheral blood mononuclear cells derived from CD3+ cells. b Bubble chart representing receptor expression of CCR2, CCR3, CCR5 and CCR6 on CD4+ and CD8+ T cells. Size of the bubble corresponds to percentage-positive cells while colour represents the median fluorescence intensity (MFI). c CCR2 receptor expression on CD4+ and CD8+ T cells (% cells and MFI). d CCR6 receptor expression on CD4+ and CD8+ T cells (% cells and MFI). e t-SNE plots showing receptor expression distribution on CD4+ and CD8+ T cells. f Co-receptor expression of CCR2, CCR3, CCR5 and CCR6 on CD4+ T cells. g Co-receptor expression of CCR2, CCR3, CCR5, and CCR6 on CD8+ T cells. c, d Contour plots show a representing sample from PLWHEC, PLWHART and HC corresponding to the median % of cells within each group. a, c, d, f, g Statistical significance was determined using two-tailed Mann–Whitney U-test (significance level p < 0.05, with *<0.05, **<0.001) and represented as pie charts or with median using 95% CI.

