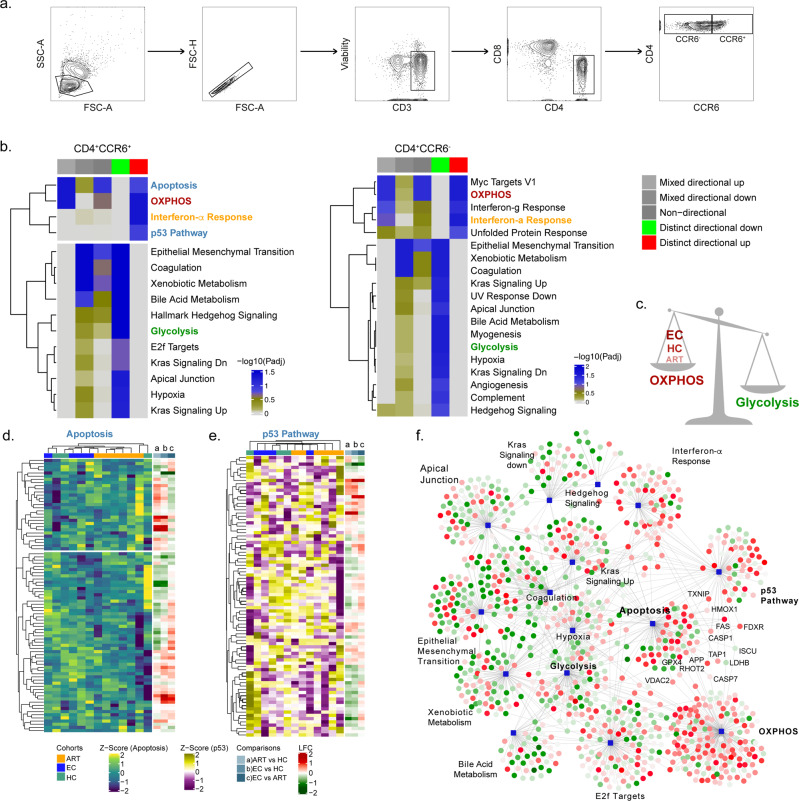
Fig. 5. CD4+CCR6+ are enriched in proteins from p53 and apoptosis signalling in PLWHEC compared to PLWHART.
Characteristics of CD4+CCR6+ and CD4+CCR6− cell populations isolated by FACS from PLWHEC (n = 4), PLWHART (n = 6) and HC (n = 3). a Gating strategy for isolation of CD4+CCR6+ and CD4+CCR6− cell populations from total peripheral blood mononuclear cells, exhibited by an HC sample. b Heatmap representation of significant pathways found deregulated in CD4+CCR6+ PLWHEC compared to CD4+CCR6+ PLWHART and in CD4+CCR6− PLWHEC compared to CD4+CCR6− PLWHART using MSigDBv. Colour gradient corresponds to the negative log scaled adjusted p-values. Each column represents p-values of various directionality classes, calculated for the pathways. Non-directional p-values are calculated based on gene-level statistics regardless of the direction of expression. Mixed directional up and mixed directional down p-values are calculated using the subset of the gene statistics that are upregulated and downregulated, respectively. Distinct directional up and distinct directional down p-values are calculated from gene statistics with expression direction. c Schematic representation of metabolic trade-off between OXPHOS and glycolysis detected in the cells. d, e Heatmap representation of proteins part of apoptosis (d) and p53 pathway (e). Colour gradient corresponds to the z-score scaled normalized expression values. Column annotation represents the cohorts and row annotation visualizes the log2 transformed fold change values in each of the differential expression analysis of PLWHART compared with HC, PLWHEC compared with HC and PLWHEC compared with PLWHART. f Network visualization of significant pathways enriched in CD4+CCR6+ PLWHEC compared to CD4+CCR6+ PLWHART. Each edge represents association of the protein with the corresponding pathways. Circular nodes denote proteins and square-shaped nodes are pathways. Red colour gradient and green colour gradient represent upregulation and downregulation of the proteins in CD4+CCR6+ PLWHEC compared to CD4+CCR6+ PLWHART.

