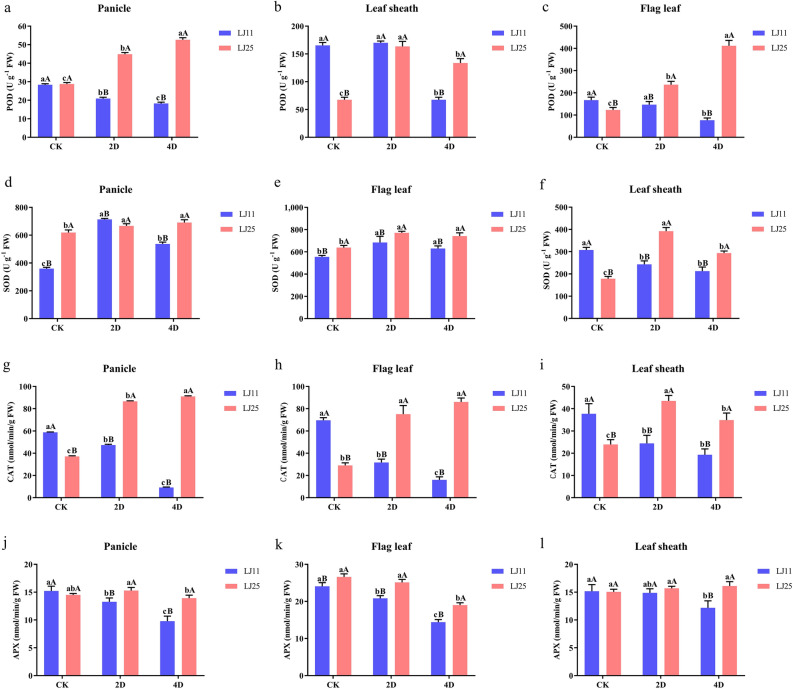
Figure 3.
Responses of antioxidant enzymes to LTS in different tissues of LJ25 and LJ11 at the reproductive stage. (a–c) Changes in POD activities in the panicle, flag leaf, and leaf sheath of LJ11 and LJ25, respectively. (d–f) Changes in SOD activities in the panicle, flag leaf, and leaf sheath of LJ11 and LJ25, respectively. (g–i) Changes in CAT activities in the panicle, flag leaf, and leaf sheath of LJ11 and LJ25, respectively. (j–l) Changes in APX activities in the panicle, flag leaf, and leaf sheath of LJ11 and LJ25, respectively. ‘CK’ represents ‘control group.’ ‘2D’ and ‘4D’ represent after 2 days and 4 days of LTS treatment, respectively. Lower-case letters represent significant differences among the three treatments for each genotype; upper-case letters represent significant differences between the two genotypes for each treatment. Data are the means and standard errors of three replicates (n = 3). Data with different letters indicate statistically significant differences among the treatments according to Duncan’s multiple range test (P < 0.05).

