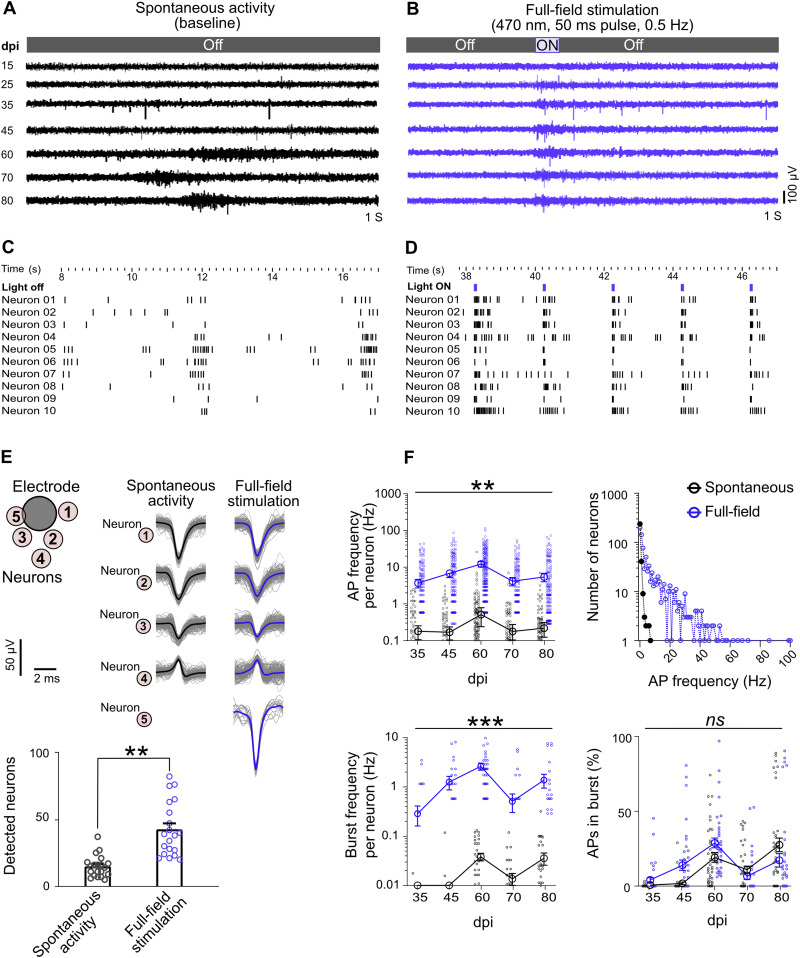
Figure 2. Full-field optogenetic stimulation elevated network activity features (blue) compared with spontaneous activity (black).
(A) Spontaneous activity from a representative electrode over time, from 15 to 80 days post induction (dpi). (B) Full-field stimulation: optically evoked activity in the same electrode on different days. (C) Raster plot of detected action potentials in 10 neurons on 60 dpi (also see Fig S2). (D) Raster plot of neuronal responses to 0.5 Hz light pulses of full-field stimulation (60 dpi). (E) The AP waveforms of several neurons were extracted by spike sorting in one electrode. Neuron 5 was only active during optogenetic stimulation. Bars show the average number of detected neurons per culture (n = 4 multi-electrode arrays) in stimulated and non-stimulated conditions (**P < 0.01, Wilcoxon test). Data pooled from 35 to 80 dpi. (F) Spontaneous and optogenetically evoked activity features in neuronal units. AP frequency per neuron (up-left), number of neurons firing in each frequency domains (up-right), burst frequency per neuron (bottom-left), and percentages of APs in burst (bottom-right). All full-field stimulation data presented here were averaged over the 50-ms stimulation period plus 25-ms post-stimulus time across four multi-electrode array cultures (n = 239 neurons). Points represent neurons and big circles show the average data for each day. All data are represented as mean ± SEM. Differences among groups are tested by mixed-effects analysis followed by Sidak’s multiple comparisons test (**P < 0.01, ***P < 0.001, ns not significant).

