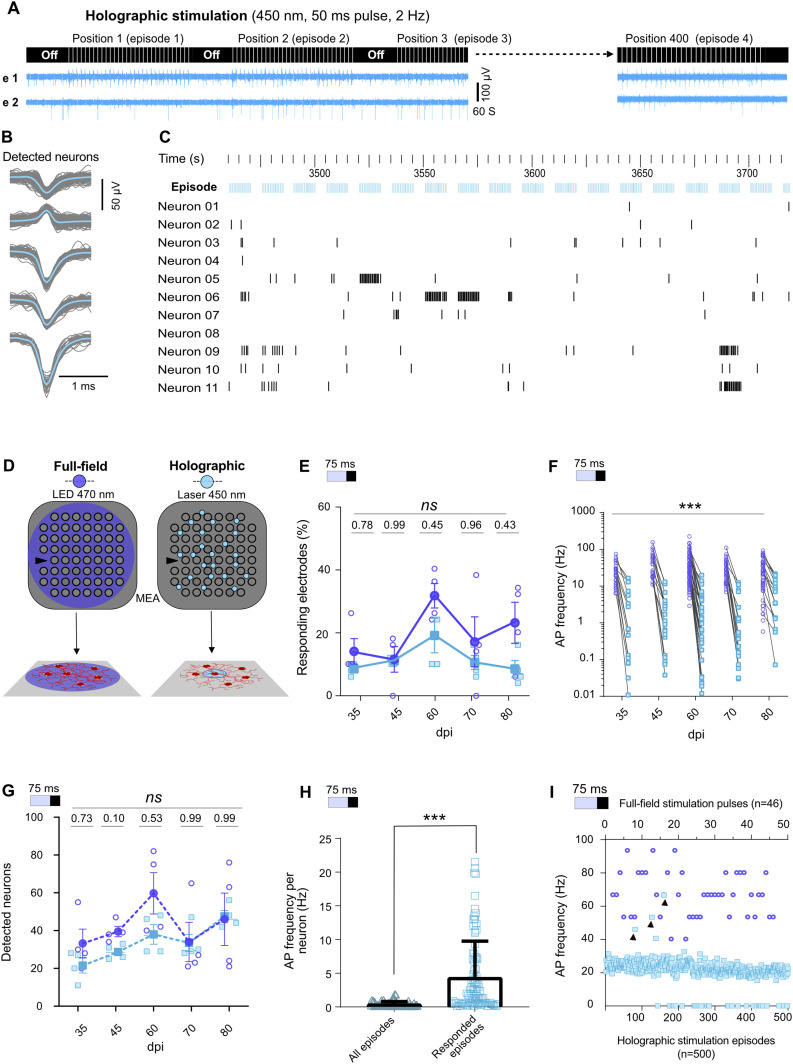
Figure 3. Activity evoked by holographic (light blue) versus full-field (dark blue) stimulation.
(A) Protocol of holographic stimulation: neurons were detected by fluorescence microscopy and then stimulated 20–30 times during each holographic stimulation episode. Every holographic experiment at each days post induction targeted on average 400 neurons, each stimulated by an episode (upper panel). Sample profiles of activity in two electrodes (e 1 and e 2) show distinct responses to holographic stimulation of neurons at different positions in the network (lower panel). (B) Detected neuronal units from holographic stimulation data of the same electrode as in Fig 2E. (C) Raster plot of 11 neuronal unit responses to 17 episodes of holographic stimulation. (D) Schematic of full-field stimulation affecting the whole network versus holographic stimulation targeting individual neurons. (E) Percentage of electrodes responding to full-field or holographic stimulations. Each point represents one multi-electrode array (MEA) (n = 4 MEAs). (F) Average activity of neuronal units in each electrode in response to full-field and holographic stimulation as measured over time (N = 4, n = 95). (G) Average number of detected neuronal units per MEA (n = 4) at different days. P-values are noted above each day. (H) Average AP frequency of neurons in successful holographic stimulation episodes versus all applied episodes. (I) AP frequencies recorded during 500 subsequent holographic stimulation episodes (blue squares) or 46 pulses of full-field stimulation (blue circles) on 35 days post induction. Black arrows indicate three holographic episodes that induced higher-frequency APs. For (E, F, G), data were compared using mixed-effect analysis followed by Sidak’s multiple comparisons test and for (H) Wilcoxon test was applied (***P < 0.001).

